Analyzing Interactions in a Slack Communication Network
We recently held a company-wide hackathon where we challenged each other to build compelling, useful applications using a streaming data source, Kafka, Memgraph, and a Web Application backend. This week we're looking at a Slack bot that can help you understand how your teammates interact.
Our team spent Hackathon week building a graph application on top of streaming Slack data. If you want to jump right to the code, check out the GitHub repo, and if you want to learn more about it, join our Discord Community Chat!
The Data Source
We knew that we wanted to do something with Slack data because the API was friendly, bots are fun to play with, and modeling with it would be relatively straightforward.
The Data Model
The bot can only gather information from channels it is a part of. Whenever you add a bot to the channel, the bot will collect the last X messages (this is configurable when starting the bot) and use those messages as cold start.
The graph model is straightforward, and it’s illustrated below:
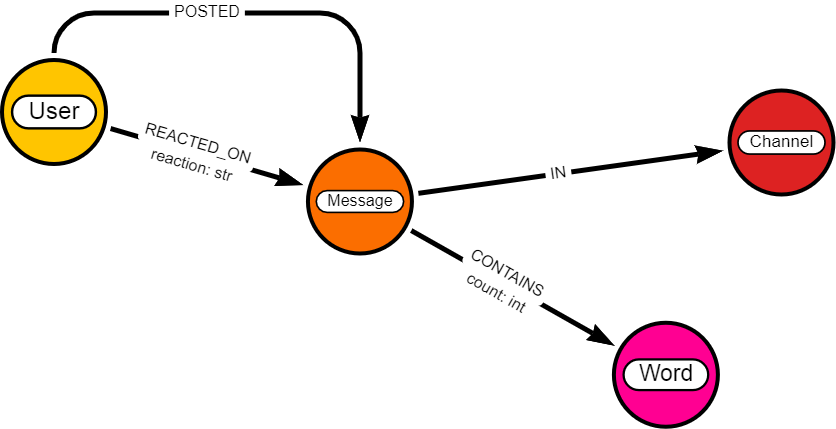
Each user represents a unique node in the graph. Users post messages in the channels. They also react with emojis to messages posted by other users.
Each message contains a certain amount of words. For styling purposes, each user, besides their unique id and name, has their avatar. There are four kinds of nodes in the graph: User, Message, Word and Channel, and we draw edges for reactions, posts, word count, and messages. This simple graph will provide the data model for our analytics.
The Full App Architecture
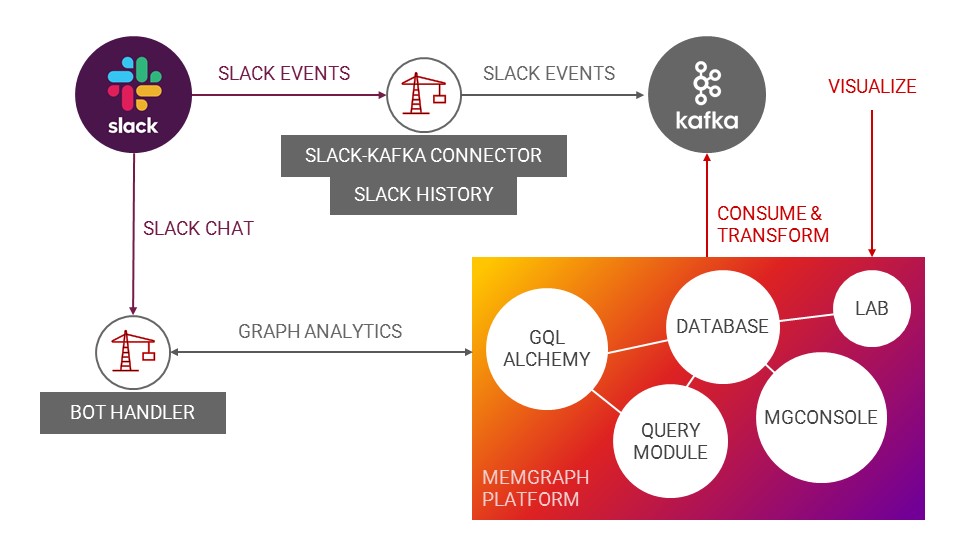
Slack offers an API that allows an application to consume messages through events. A local Kafka cluster is set up, and the producer (Slack-Kafka connector) sends the data to the Kafka broker and is then consumed in real-time by Memgraph through a stream. Memgraph then updates its knowledge graph in real-time, and the bot handler consumes the analytics upon the user's request.
This architecture can be depicted in the following picture:
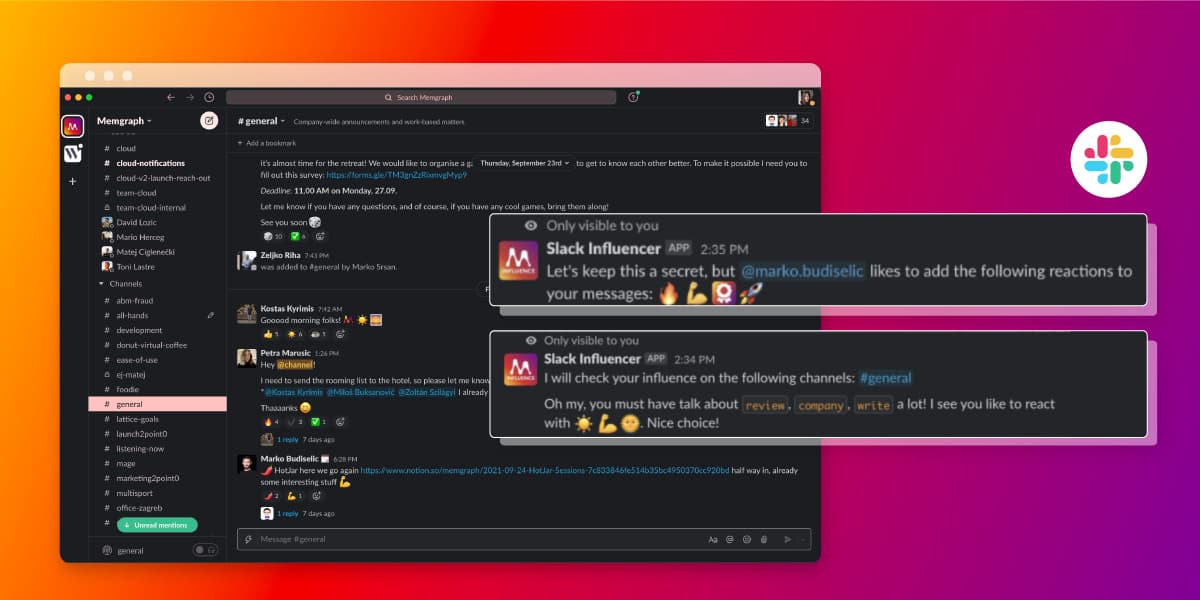
Communicating with the Bot
The user communicates with the bot in Slack chat with the help of the commands:
/influence me
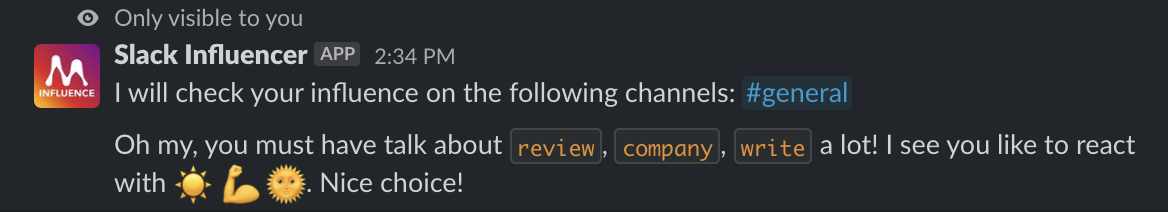
Get information about you in all the channels visible to the Bot. The Bot’s answer will contain the words you like to use in your messages and emotes you use the most to react to your fellow colleagues’ posts across all channels.
/influence me in <#channel>
Get information about you in <#channel>. The Bot’s answer will contain the words you like to use in your messages and emotes you use the most to react to your fellow colleagues’ posts in the selected channel.
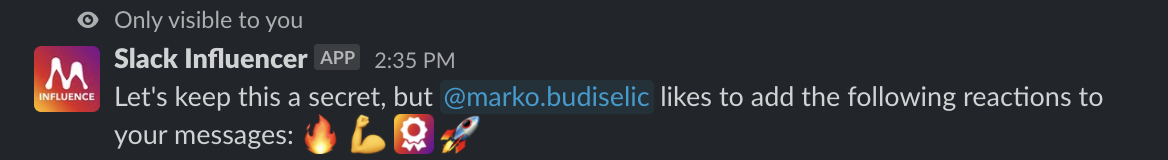
/influence myself and @user
Get information on the interaction between you and @user. The Bot’s answer will contain the reactions your fellow colleagues add to your messages.
/influence channels and reactions <reactions>
Get information about reactions in all channels visible to the bot. The Bot’s answer will contain the metrics about specified reactions you and your fellow colleagues use. It will give info about who uses the reaction the most and who receives it the most across all of the channels the bot is a part of.
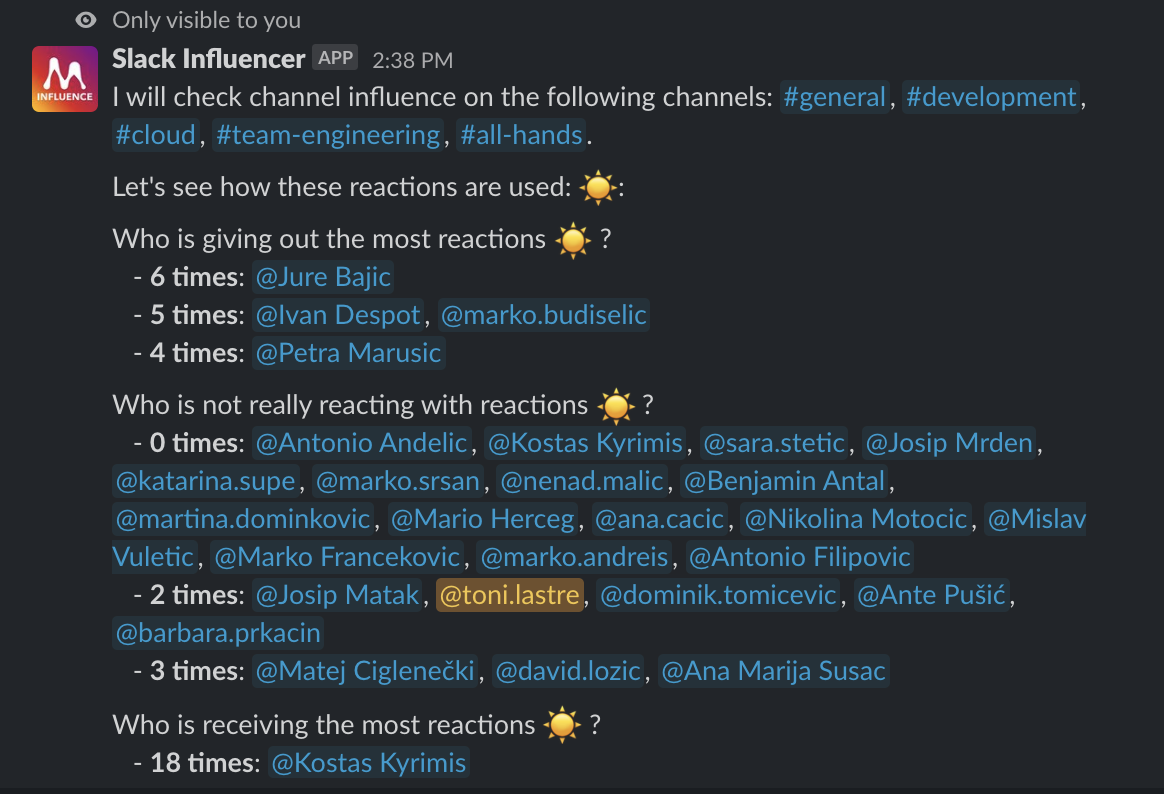
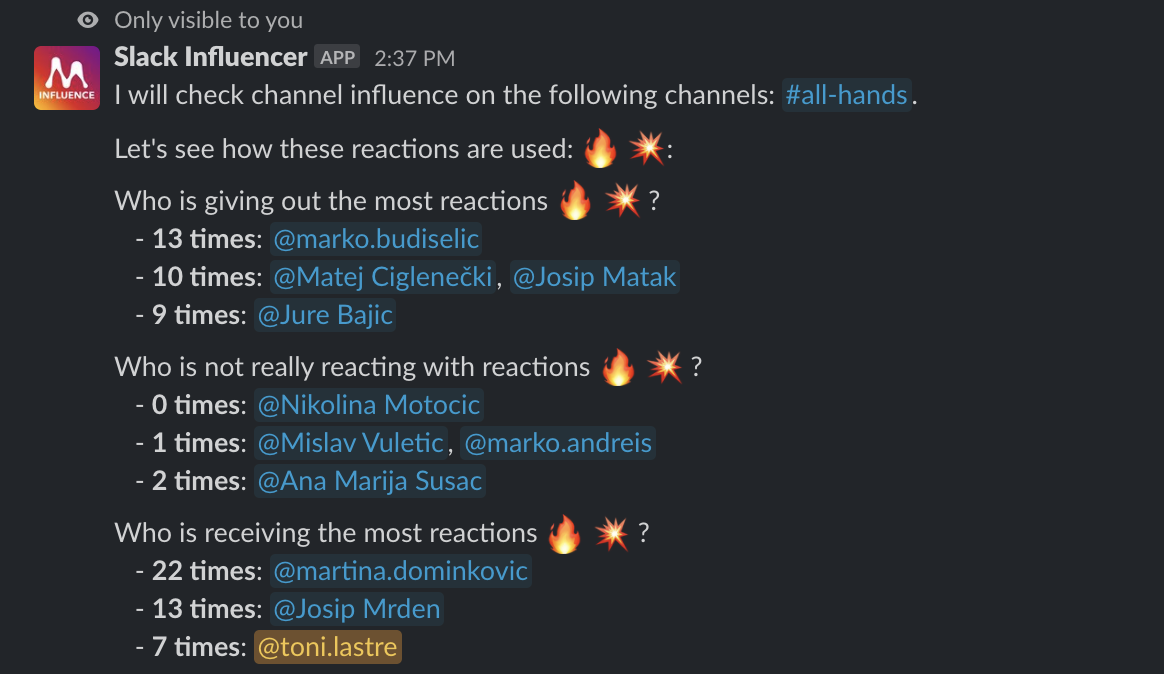
/influence channel <#channel> and reactions <reactions>
Get information about reactions in <#channel>. The Bot’s answer will contain the metrics about specified reactions you and your fellow colleagues use. It will give info about who uses the reaction the most and who receives it the most.
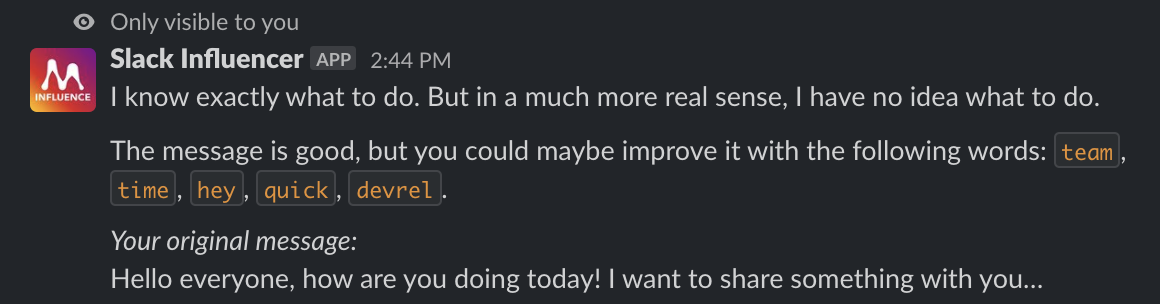
/influence messages <text>
Get information on how to improve your message. The Bot’s answer will contain suggestions on words that should be added to your message to improve it and potentially receive more reactions in the end.
In The Lab
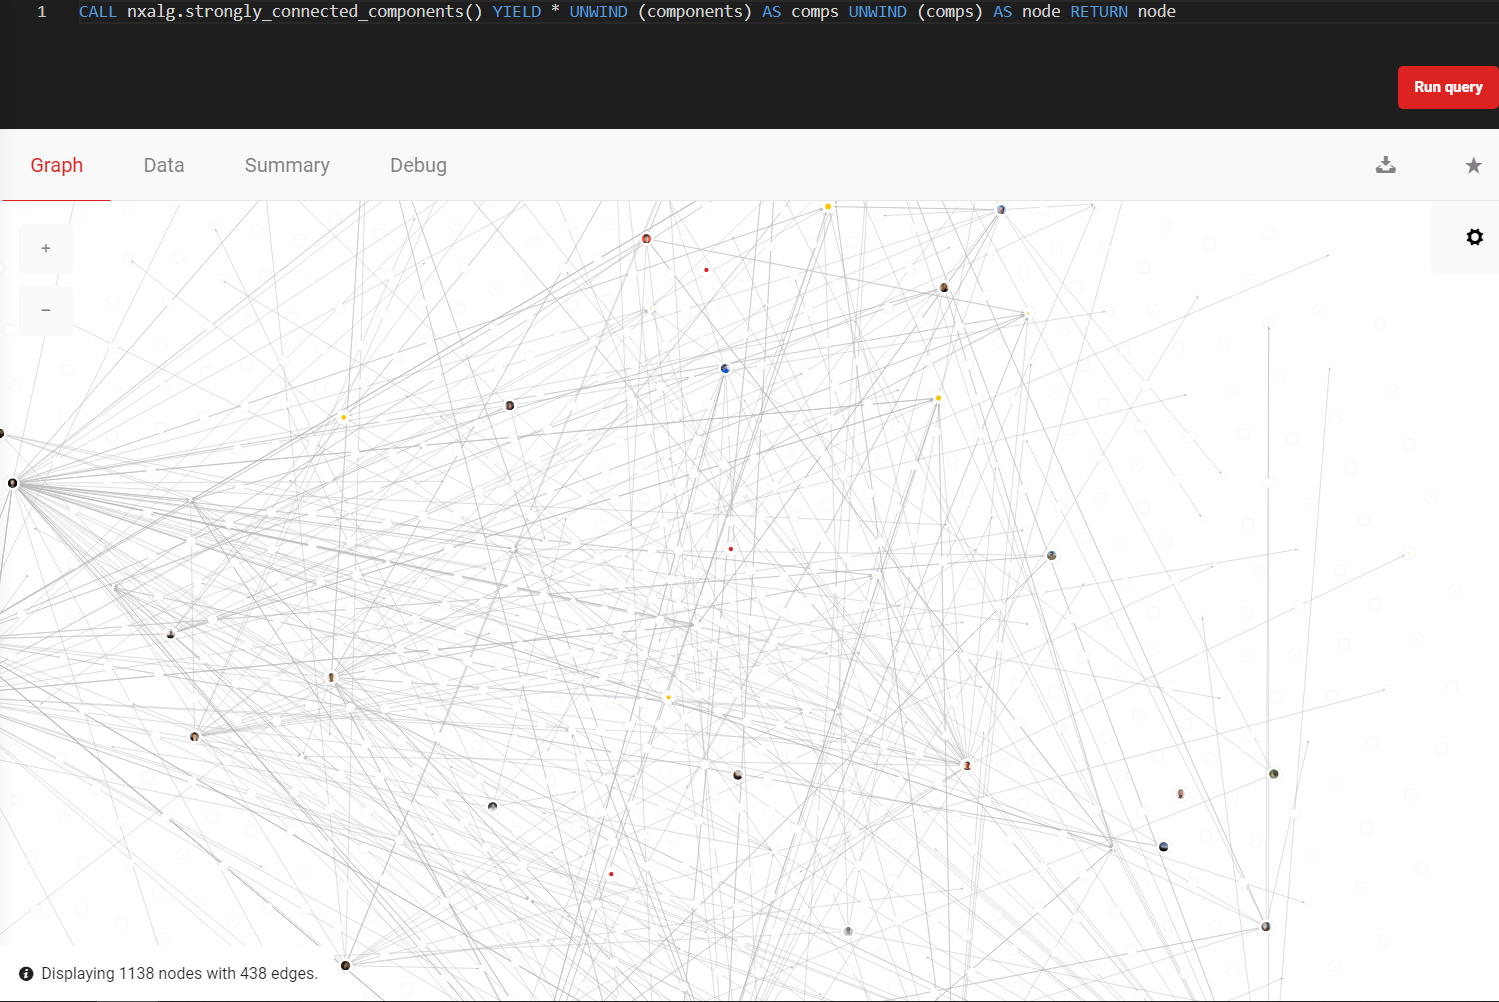
We used the Memgraph Lab to visualize the data and understand our schema better. What we found interesting is how the graph was connected, strongly connected components, and the people who connected these strongly connected components.
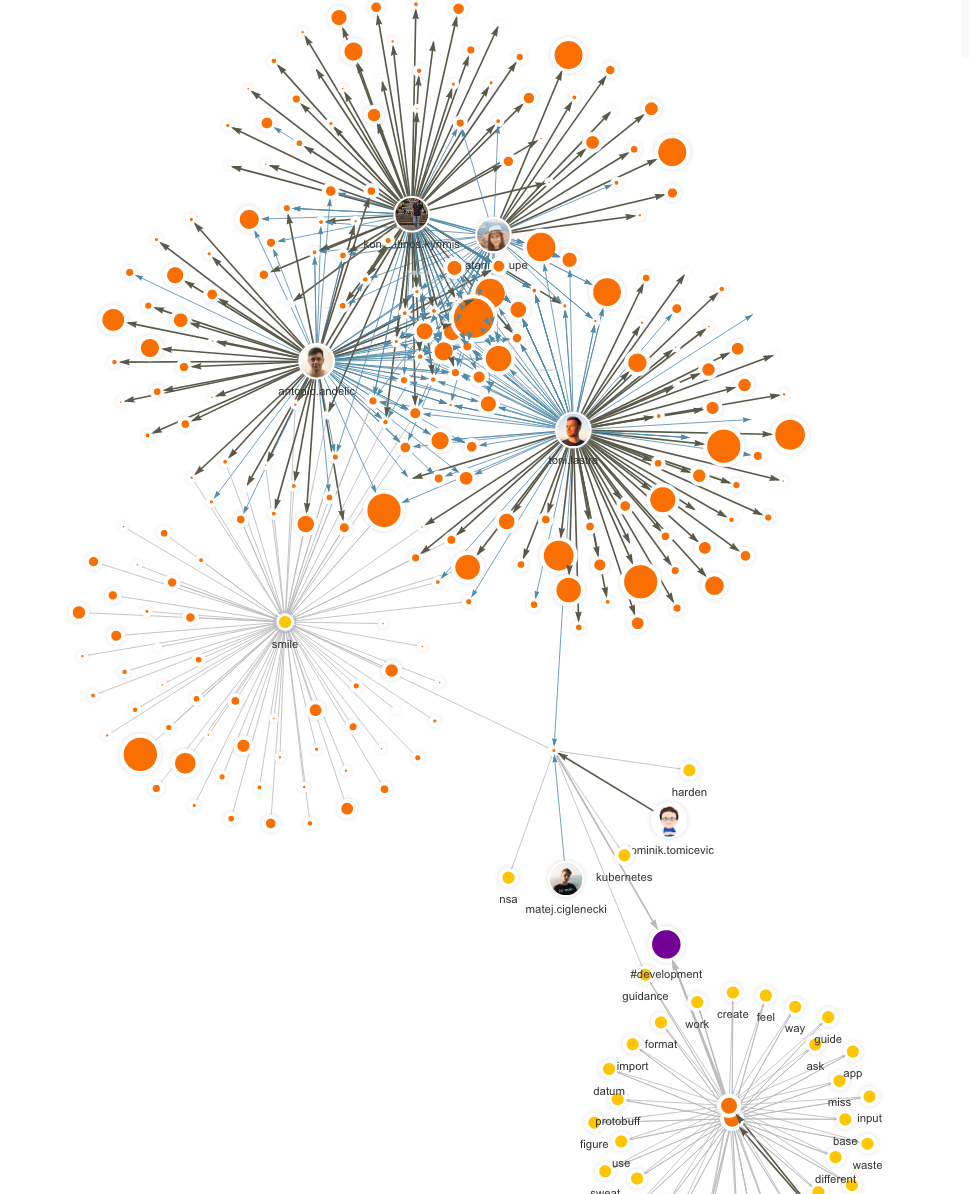
Exploring how the graph is connected can be done using Memgraph’s integrated
NetworkX algorithms and query modules. To find strongly connected components, we
used the NetworkX algorithm strongly_connected_components. This
algorithm
is implemented within the nxalg query module in Memgraph
MAGE. The picture below shows one strongly
connected component from our humongous graph.
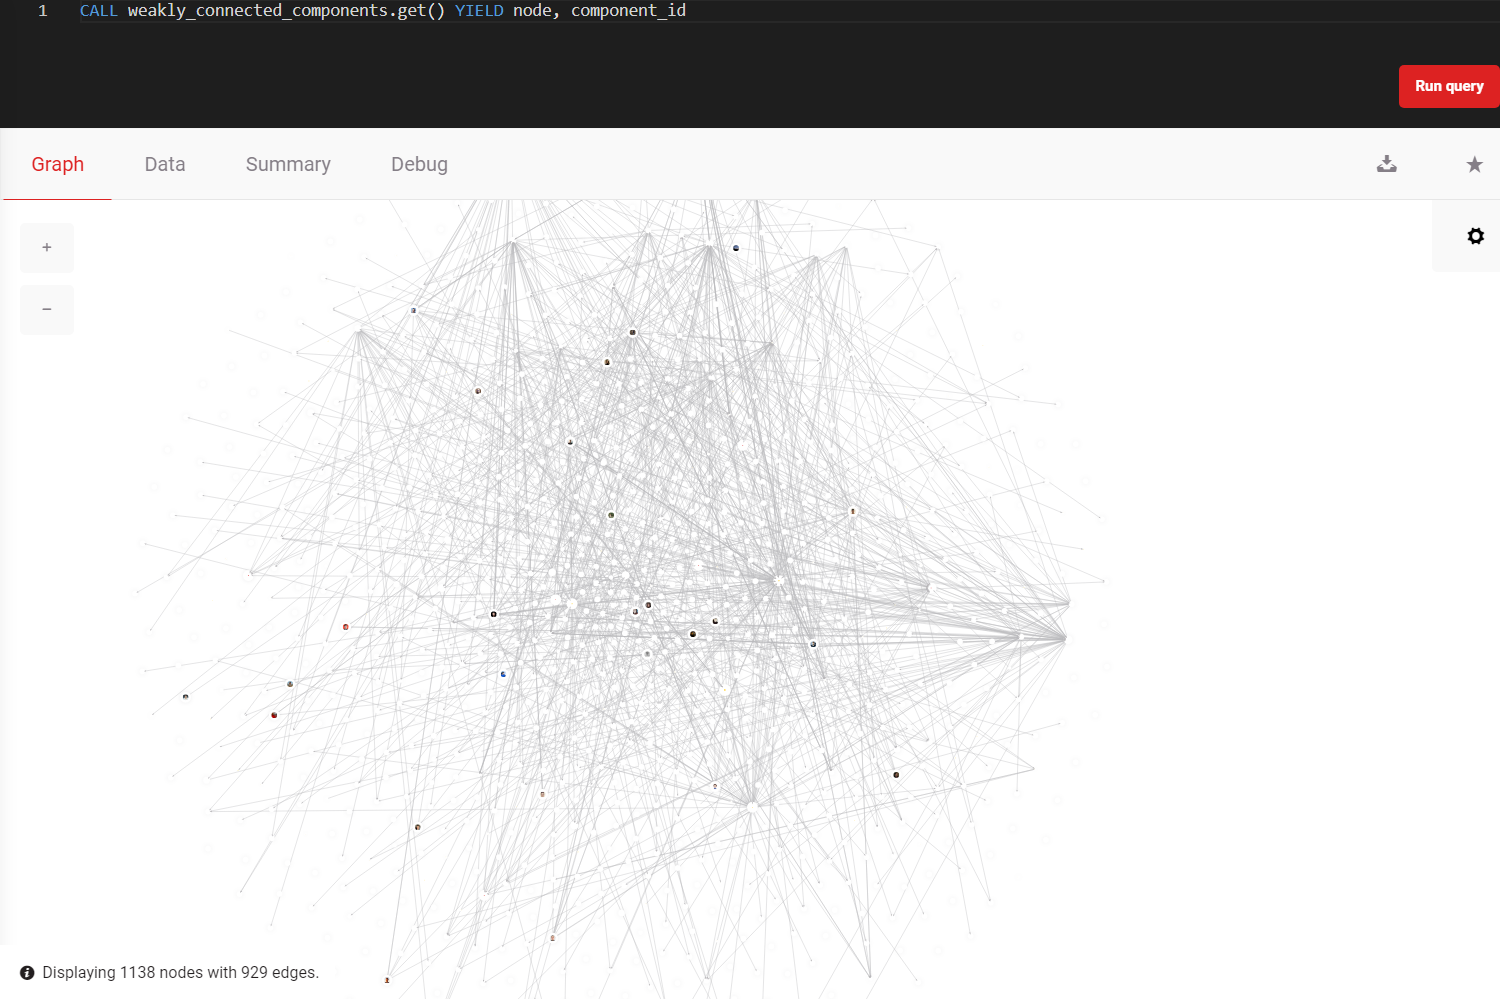
It’s also possible to run the opposite components algorithm - weakly connected components. Weakly connected components are part of custom implemented query modules within Memgraph Mage.
Conclusion
Slack Influencer was developed for an internal Hackathon at Memgraph to demonstrate the simplicity and the power of knowledge graphs combined with streams. It was a very fun experiment, especially when we ran it internally at Memgraph.
If this sounds cool to you, check out the GitHub repo, and let us know what you think in our Discord Community Chat!