
How Can GraphRAG Improve Personalized Patient Care
Personalized medicine sounds great in theory: tailor treatments to each patient’s biology, history, and lifestyle. In practice, most care is still one-size-fits-all. Why? Because patient data is scattered.
- Medical histories live in EHRs.
- Lifestyle and environment data live in wearables or public health databases.
- Genomic or lab results often sit in separate silos.
Clinicians rarely see the whole patient. Without that context, it is hard to connect genetic predispositions with lifestyle choices, or treatment responses with social determinants. This fragmentation limits coordinated care and prevents comprehensive, long-term view of patient health.
Modeling Patient Journeys as a Graph
Graph databases bridge this data gap. By unifying this fragmented patient data, a graph database doesn’t just store patient information, it models critical relationships into a unified structured representation.
Think of each patient as a central node connected to multiple types of data: diagnoses, prescriptions, lab results, daily activity logs, wearable data, and even socioeconomic or environmental factors.
Each of these nodes may themselves connect to additional nodes, forming a dense, multi-layered network. For example:
- A prescription might link to known drug interactions.
- Lab results may connect to historical trends.
- Lifestyle factors may link to population-level health data.
These connections are not linear. They form a complex network where one factor can influence many others. This structure lets you see interactions like how social determinants combine with genetics to affect outcomes.
Once data is modeled as a knowledge graph, you can apply algorithms to find patterns and insights that traditional databases cannot. For instance, it can:
- Detect hidden dependencies between treatments and outcomes.
- Cluster patients with similar health or lifestyle profiles.
- Trace pathways that lead to positive or negative results.
The result is a holistic view of patient health. Clinicians can spot trends early, understand complex influences, and tailor interventions to the individual.
By turning isolated data points into a connected graph, healthcare providers can move from reactive treatment to proactive, personalized care.
Key Algorithms
Graphs become powerful when paired with algorithms that expose patterns in patient journeys. Some common algorithms that prove useful are:
- Graph Traversals (BFS, DFS): Follow a patient’s record across multiple hops to uncover indirect links. For instance, BFS can trace how a side effect in one treatment connects to outcomes in patients with a similar genetic marker.
- Path Finding (WSP, ASP): Identify the shortest or most effective care pathways. This can suggest the optimal treatment sequence for a chronic condition or help understand typical disease progression.
- Community Detection: Cluster patients who share similar profiles. This helps providers test hypotheses like “Do patients with both X lifestyle factor and Y medication adherence cluster into a higher-risk group?”
These aren’t abstract academic tools. They are practical methods that directly affect how clinicians interpret patient histories and design interventions.
Graph In Action: Personalized Type 2 Diabetes Care
Managing chronic conditions like Type 2 diabetes is a global health challenge. In the U.S. alone, nearly one in six adults live with diabetes. A significant portion, 95% of Type 2 cases, stem from lifestyle factors. Preventing these numbers from rising is a top priority for health systems.
Visualizing these complex patient journeys becomes key to tackling this challenge. Precina Health took this challenge head-on. They leveraged GraphRAG to systematize Type 2 diabetes management, helping patients reduce their Hemoglobin A1C (HbA1C) by 1% per month (compared to typical annual reductions). Their approach factored in not only clinical care but also social determinants and behavioral insights.
This system, named P3C (Provider-Patient CoPilot), suggests small, patient-specific adjustments using AI, helping care providers make better decisions. Here’s how it works:
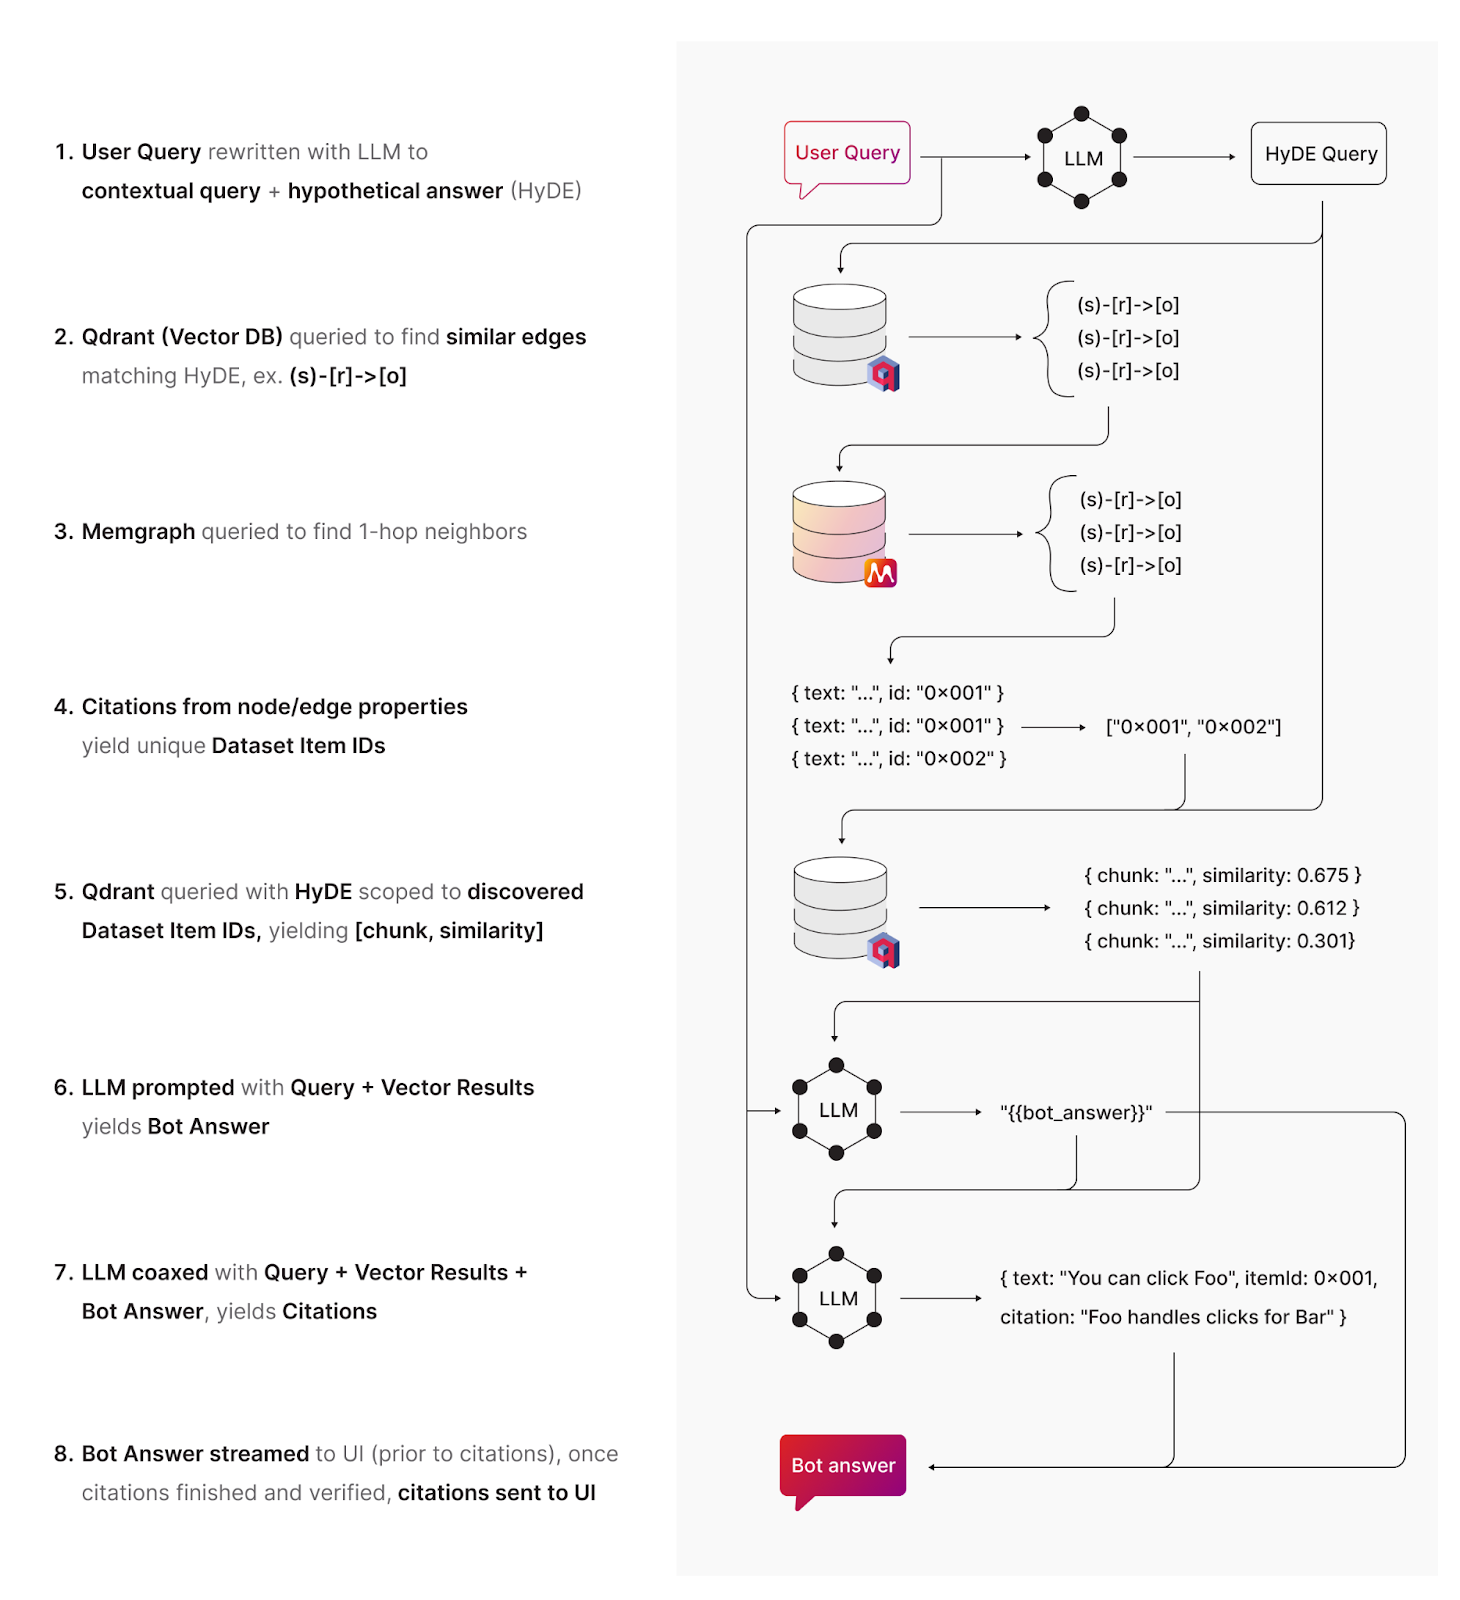
In practical terms, the system helps providers respond to real-time patient inputs. Whether it’s insulin levels or a patient’s emotional state, GraphRAG delivers actionable insights.
Wrapping Up
Personalized care is not about collecting more data. It is about connecting data. GraphRAG surfaces the hidden context that guides better treatment paths, reduces errors, and drives measurable improvements in chronic disease management.
Curious about other GraphRAG healthcare application? The guide How Graph-Powered AI Is Accelerating Discovery and Care in Healthcare and Biotech goes deeper into the technical frameworks and more use cases across healthcare and biotech. It’s a practical resource for anyone looking to see how GraphRAG can transform patient care and accelerate discovery.