
Choosing the optimal index with limited information
Let’s start with a riddle… What is it: everyone uses it, and only a few know when it should be used, but no one uses it correctly. It must be indexes, of course. 🚀
What is an index?
Indexes are data structures used in databases for fast data retrieval. Declarative query languages like Cypher are compiled into a set of operators, yielding a query plan. All operators, including those related to indexes, are optimized to produce as few nodes as possible.
The specific problem this blog post will dive into is how databases can choose the optimal index from a set of feasible indexes when searching nodes by filters. The described methodology will be based on graph databases but it can be employed in the same way in relational databases as well.
What is the problem?
The following example will help us to understand the problem at hand.
Let’s say there are two label-property indices in the database, :Person(grade) and :Person(is_driver). The database contains 200 persons with grades A, B, C, D or E, 500 persons are drivers, and 400 aren’t drivers, so in total, there are 900 person nodes stored in the database.
The user queries the database with the following query:
MATCH (p:Person)

WHERE p.grade = “A” and p.is_driver = True

RETURN p
The optimal query plan would choose the label-property index that contains fewer nodes with one condition satisfied (p.grade = “A”) and then use the second filter (p.is_driver = True) to get all nodes satisfying both conditions. The number of results produced by the database is called hits.
Considering that the index saves the list of nodes, the task of deriving the optimal index boils down to a computer science problem of choosing the list with as few hits as possible.
You are probably wondering why not just count nodes with grade A (200) and drivers (500), compare those two numbers, and choose the one with fewer nodes (200)? Such an approach is impossible because, at the moment of choosing the optimal index, concrete values used for filtering nodes (“A”, True) are unknown.
So how would one come to choosing the list with as few hits as possible? There are several approaches.
#1 Count the number of vertices
The simplest heuristic approach is to approximate the number of nodes with some concrete property value (grade = “A”) with the number of all nodes that have that property.
In our example, instead of comparing 200 and 500, we would compare nodes with the grade property (1000) with nodes that have a known driver status (900) and return the latter one. It is easy to see that this approach has big flaws because it doesn’t take into account values on a fine-grained scale.
In the example above, whether the user searches for all drivers (500) or non-drivers (400), we would always like to return the index with grades since no matter which grade is being queried, it always contains fewer nodes (200).
#2 KISS (almost) always works
Instead of summing group sizes, a better way is to calculate the average group size. The calculation combines the number of distinct property values and group sizes into a single measure, thus providing information about the average number of hits.
In our example, we wouldn’t compare nodes containing grade property (1000) and nodes with known driver information (900) but rather calculate an average group size for each node with grade property and for each node with known driver info.
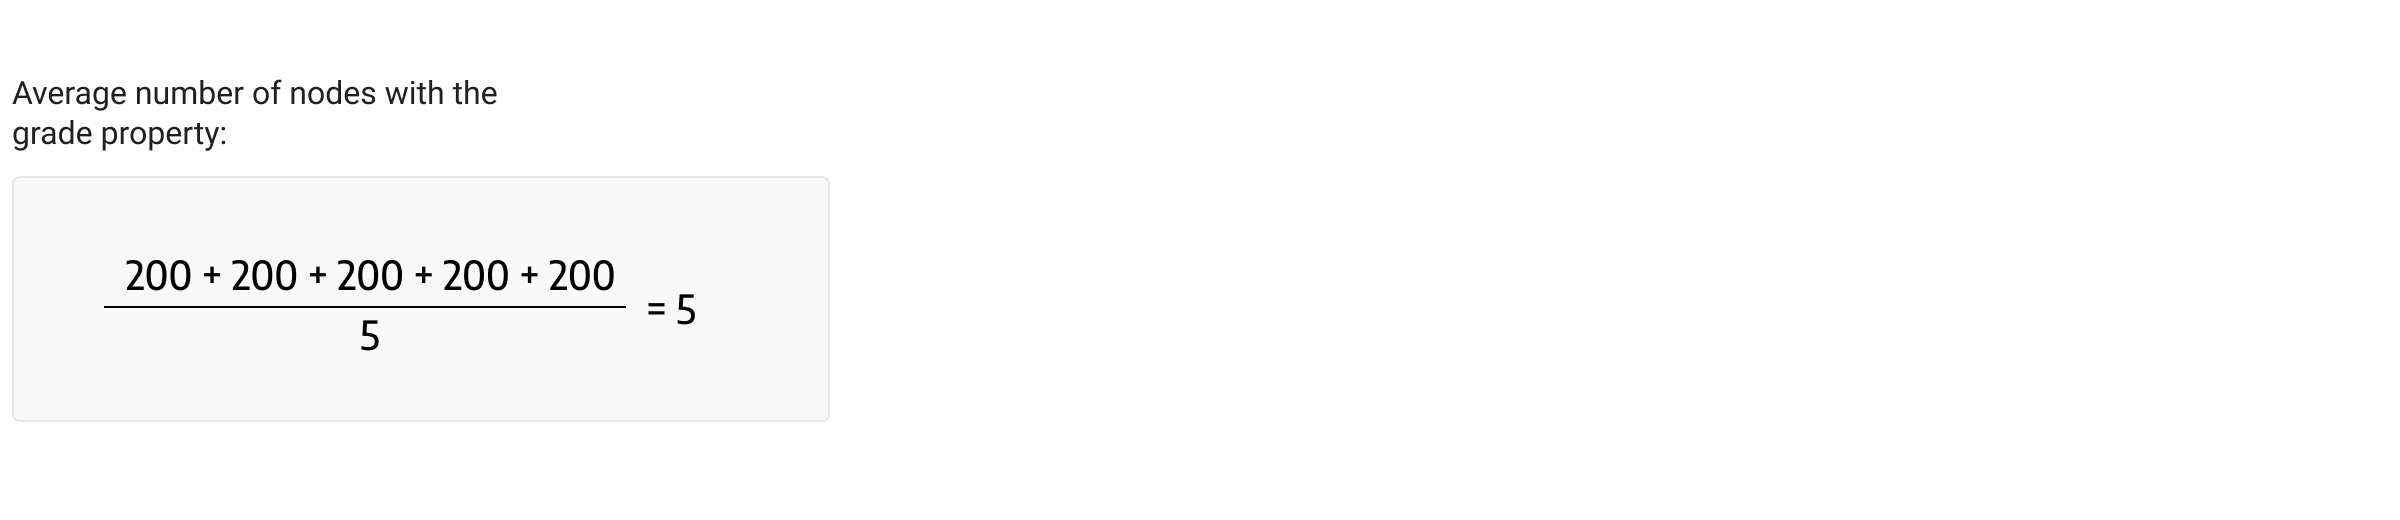
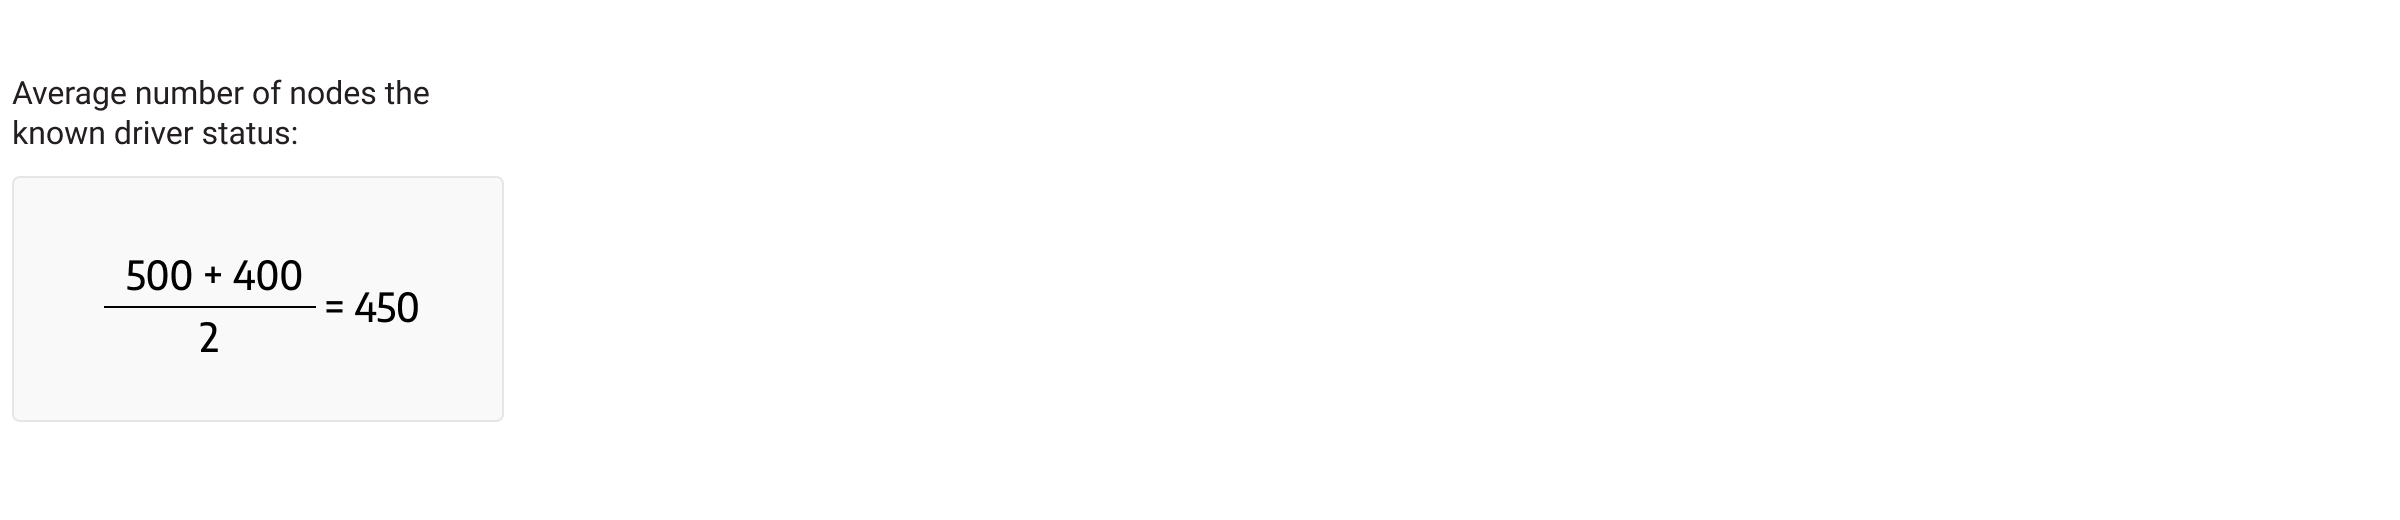
The averages show that the grade property contains information of higher quality since its average group size (200) is smaller than the average group size for the driver information (450). This solution is great for two reasons. It is extremely easy to calculate an average and it gives us an interpretable estimate of the number of hits. A real Keep-It-Simple-Stupid (KISS) masterpiece. ✨
#3 Probabilistic icing on the cake
However, centrality measures can also be misleading.
Let’s say that instead of 500, there are 300 drivers and instead of 400 non-drivers, there are 100 of them. The average group size is now the same for both properties.
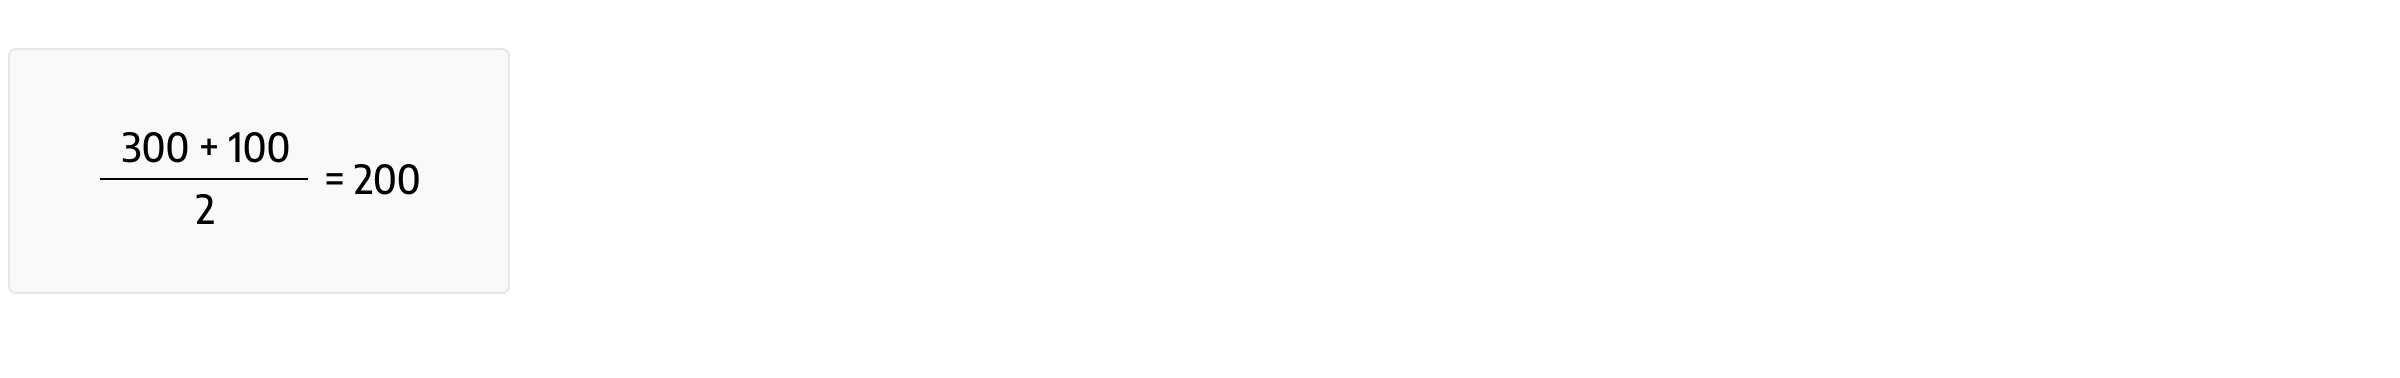
Nonetheless, it somehow appears there is a bigger chance of finding a node when all groups are of size 200 than when one group has 100 nodes and the second 300 nodes. Why is that?
Well, the probabilistic approach can help here. The first group conforms to the uniform distribution, so all values contained in the first case equally contribute to the expected number of hits. For measuring the distribution’s conformity to the uniform distribution, we decided to use the chi-squared statistics:
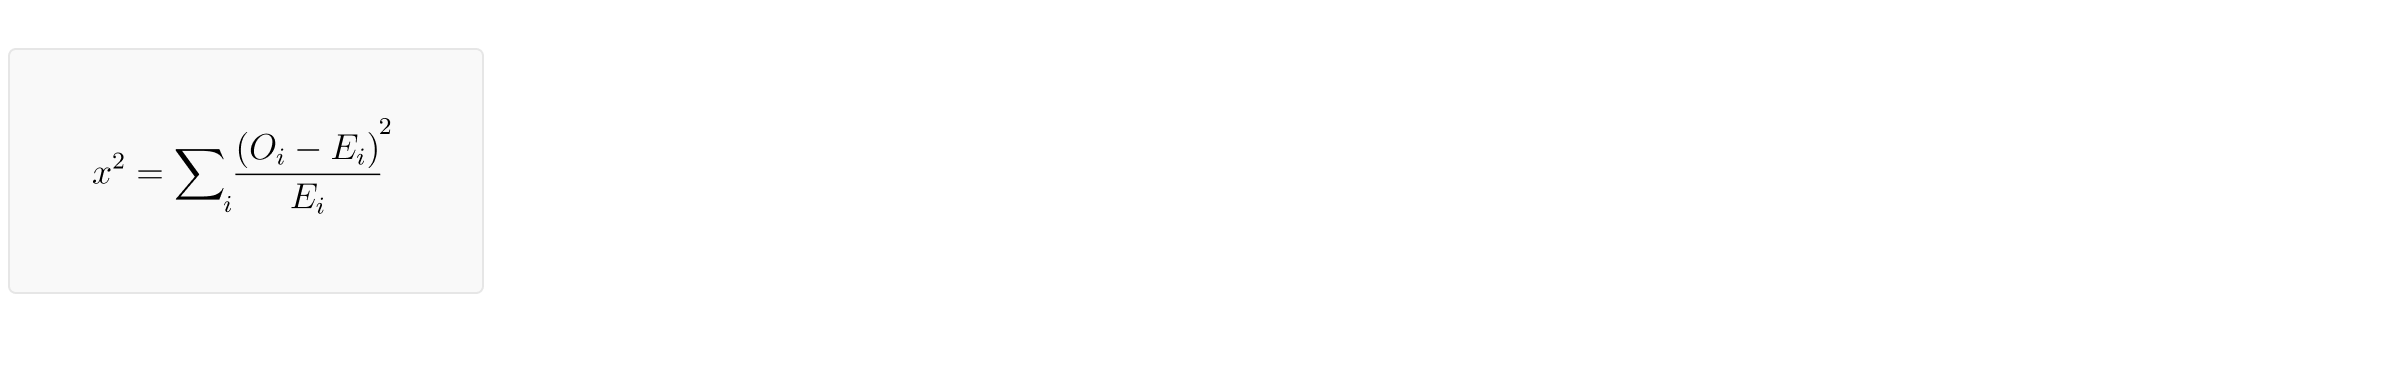
In our case, the Oi is the group size, and Ei is the expected group size. When the distribution is uniform, as in the case of grade property, the chi-squared statistic is 0. In all other cases, the expected group size is calculated as the total group size divided by the number of distinct values.
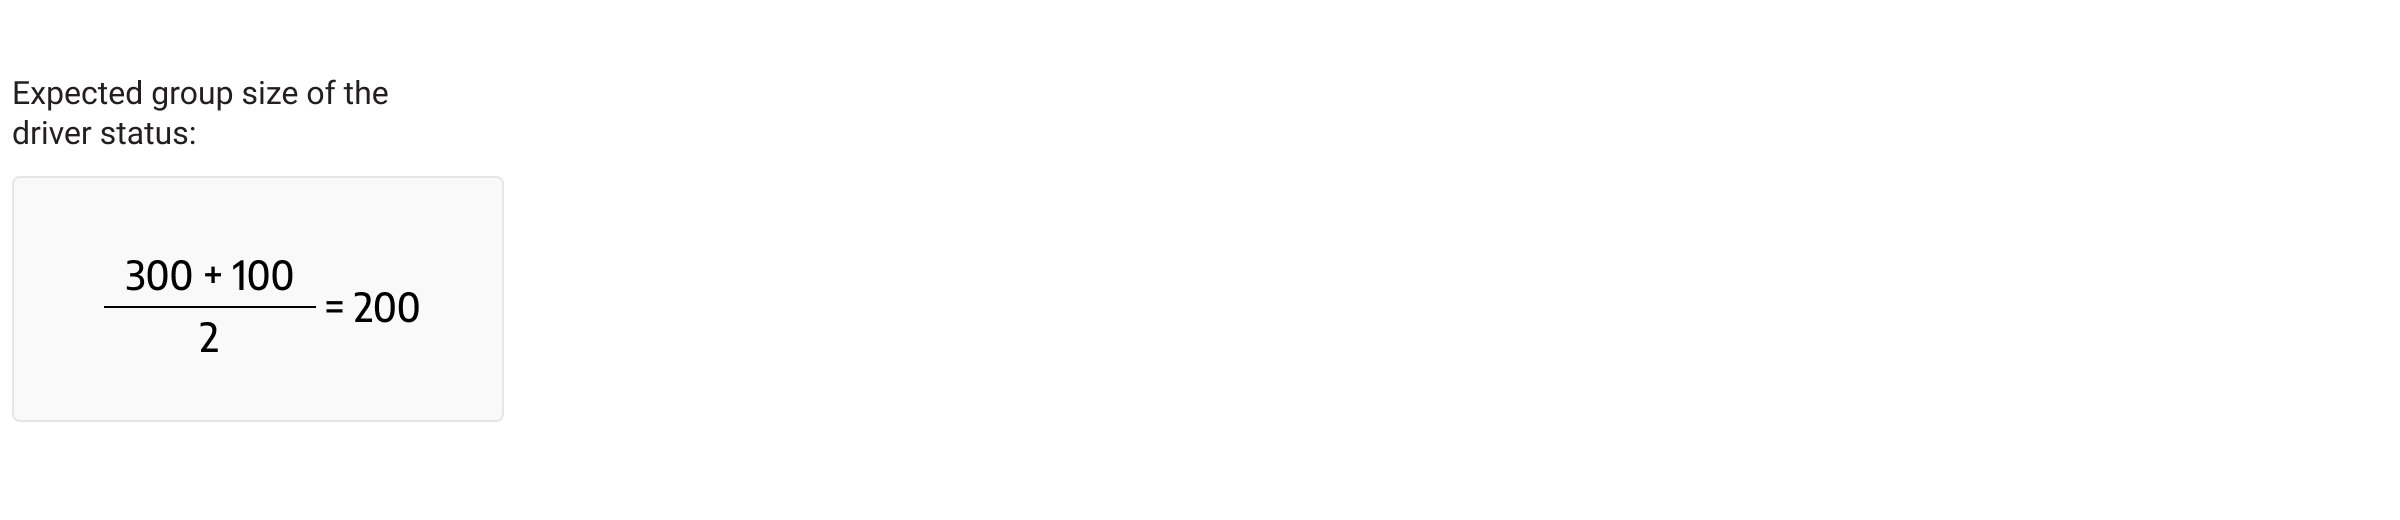
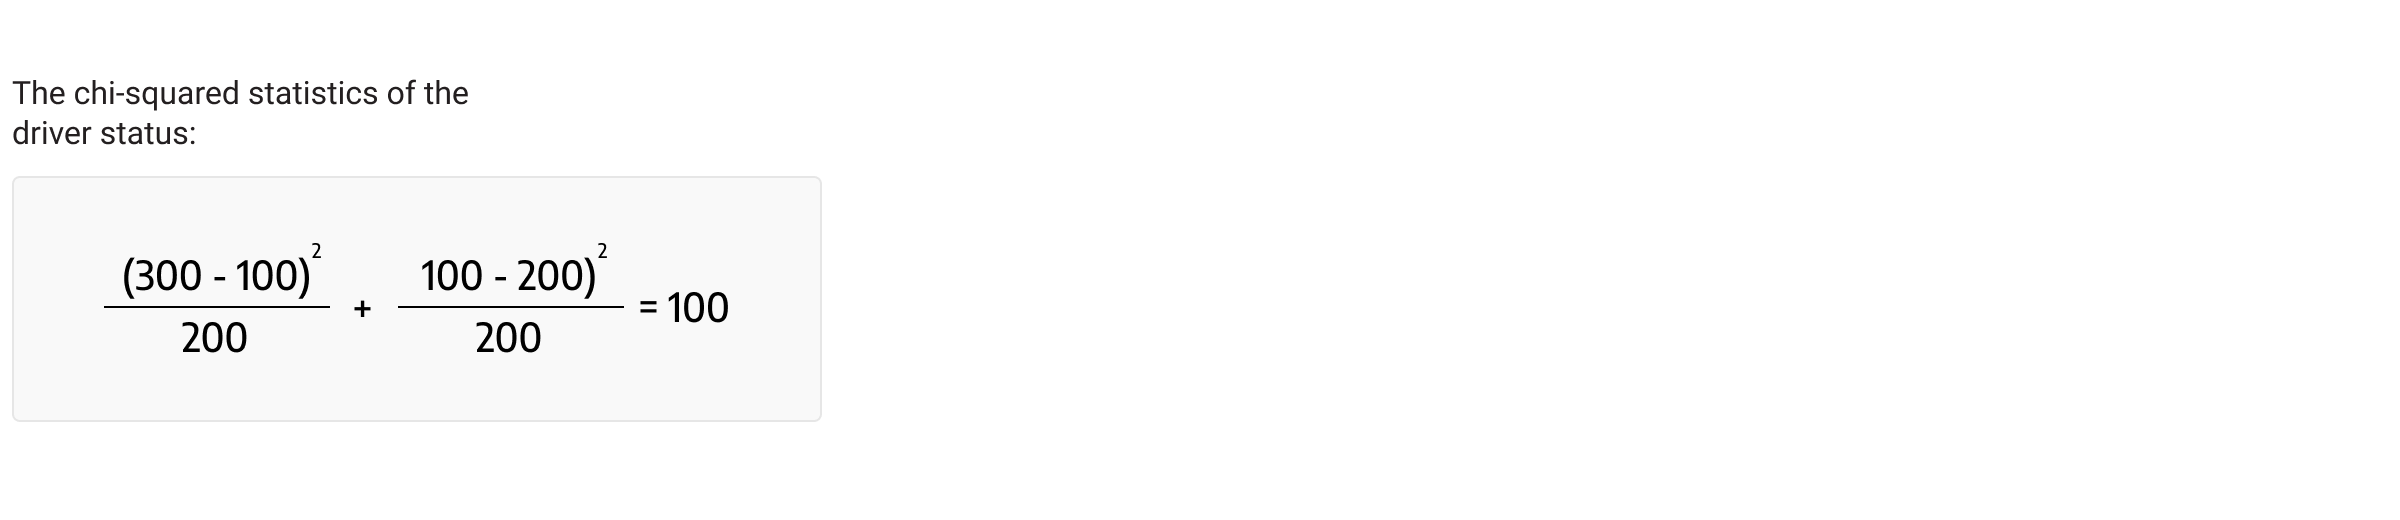
In the case of driver information, the expected group size is 200, and the chi-squared statistics is 100.
Since the chi-squared statistic of the driver status (100) is larger than the chi-squared statistic of the grade property (0), we would choose the grade property. Note that other measures could have been used instead of chi-squared, like entropy or KL divergence. However, because of its simplicity and interpretability, we decided to stick with the chi-squared statistic.
#4 Memgraph futuristic database
As for the last part, we would like to zoom into one detail. The reason why group size is averaged is that the reasonable assumption is used in which every property value has an equal chance of being queried by the user. This opens the door to making Memgraph a self-learnable database capable of learning users’ querying characteristics and optimizing them for specific cases by learning the distribution of their queries 🤯.
Wrap up
The problem of choosing the optimal index with limited information has proved to be challenging. Since we don’t know which property values are used when querying, it is impossible to cover all cases. However, the estimation approach with averaging group size and measuring the similarity with uniform distribution proved to work great in most of the cases Memgraph is dealing with. If you have an idea for quantifying the list’s quality of containing vertices of interest, we’d be pleased to hear it. 🫡