
Stop the Next Breach: Cyber Graphs for Post-Incident Network Monitoring
204 days to spot a breach. Another 73 to contain it.
That’s the average timeline, according to IBM’s Cost of a Data Breach Report 2024. And the longer it takes to see what happened, the more damage is done.
So why does it take so long? It’s not because your team isn’t smart or your tools aren’t good enough. It’s because attackers don’t stay in one place. They move laterally by pivoting across users, systems, and processes, leaving breadcrumbs that are almost impossible to piece together when you’re staring at disconnected logs.
If you want to catch breaches faster, you need a better way to see the full story.
This is where graphs come in.
Track Lateral Movement Effectively
When an attacker gets in, they don’t just sit still. They move laterally, jumping from one compromised system to another, escalating privileges, and finding new ways to stay hidden.
But traditional monitoring tools often miss these pivots. Logs alone rarely tell the whole story. A single event might look harmless until you see it in context, linked to suspicious logins, odd data transfers, or unexpected connections between subnets.
This is where graphs come in.
Graphs Map the Full Story of a Cyber Attack
Graphs can help reveal these lateral movements, uncovering how attackers pivoted activities across users, processes, and systems.
This makes it easier for security teams to answer post-incident questions like:
- Which systems did this compromised user touch?
- How did the attacker move laterally?
- Which data assets were accessed after privilege escalation?
For instance, what might look like a normal process execution in a log file becomes far more suspicious when linked to a recent login from an unusual IP and an outbound data transfer. The result is faster investigations, clearer root cause analysis, and a stronger chance of stopping the next breach before it spreads.
No more guesswork. No more hours wasted piecing it together one log at a time.
The Analyst’s Edge: Graph Algorithms in Action
A graph database doesn’t just visualize events. It uses graph algorithms to pinpoint the riskiest connections. Here are some key algorithms to make this possible:
| Betweenness Centrality | It identifies nodes (users, IPs, processes) acting as bridges in event sequences. It is useful to detect pivot points used in lateral movement. |
| Bridges | It highlights weak links or chokepoints by detecting critical connections (e.g., between users or systems) which, if compromised, would isolate parts of the event graph. |
| Connected Components | It groups together events or entities that are linked. It is useful to isolate related activity clusters in an incident (e.g., all actions related to a compromised user). |
Visualizing the Threat: Detecting Pivot Points with Betweenness Centrality
In the aftermath of a breach, one of the most critical tasks is understanding how attackers moved through the network. Were they confined to a single machine, or did they pivot between subnets, reaching sensitive assets undetected?
One of the most effective algorithms for this kind of analysis is Betweenness Centrality. This algorithm identifies nodes that act as bridges or chokepoints. These are the same nodes an attacker might use to move laterally or exfiltrate data.
These nodes may not be the most connected overall, but they often lie on the shortest paths between multiple other systems, making them strategically important. The diagram below illustrates this concept.
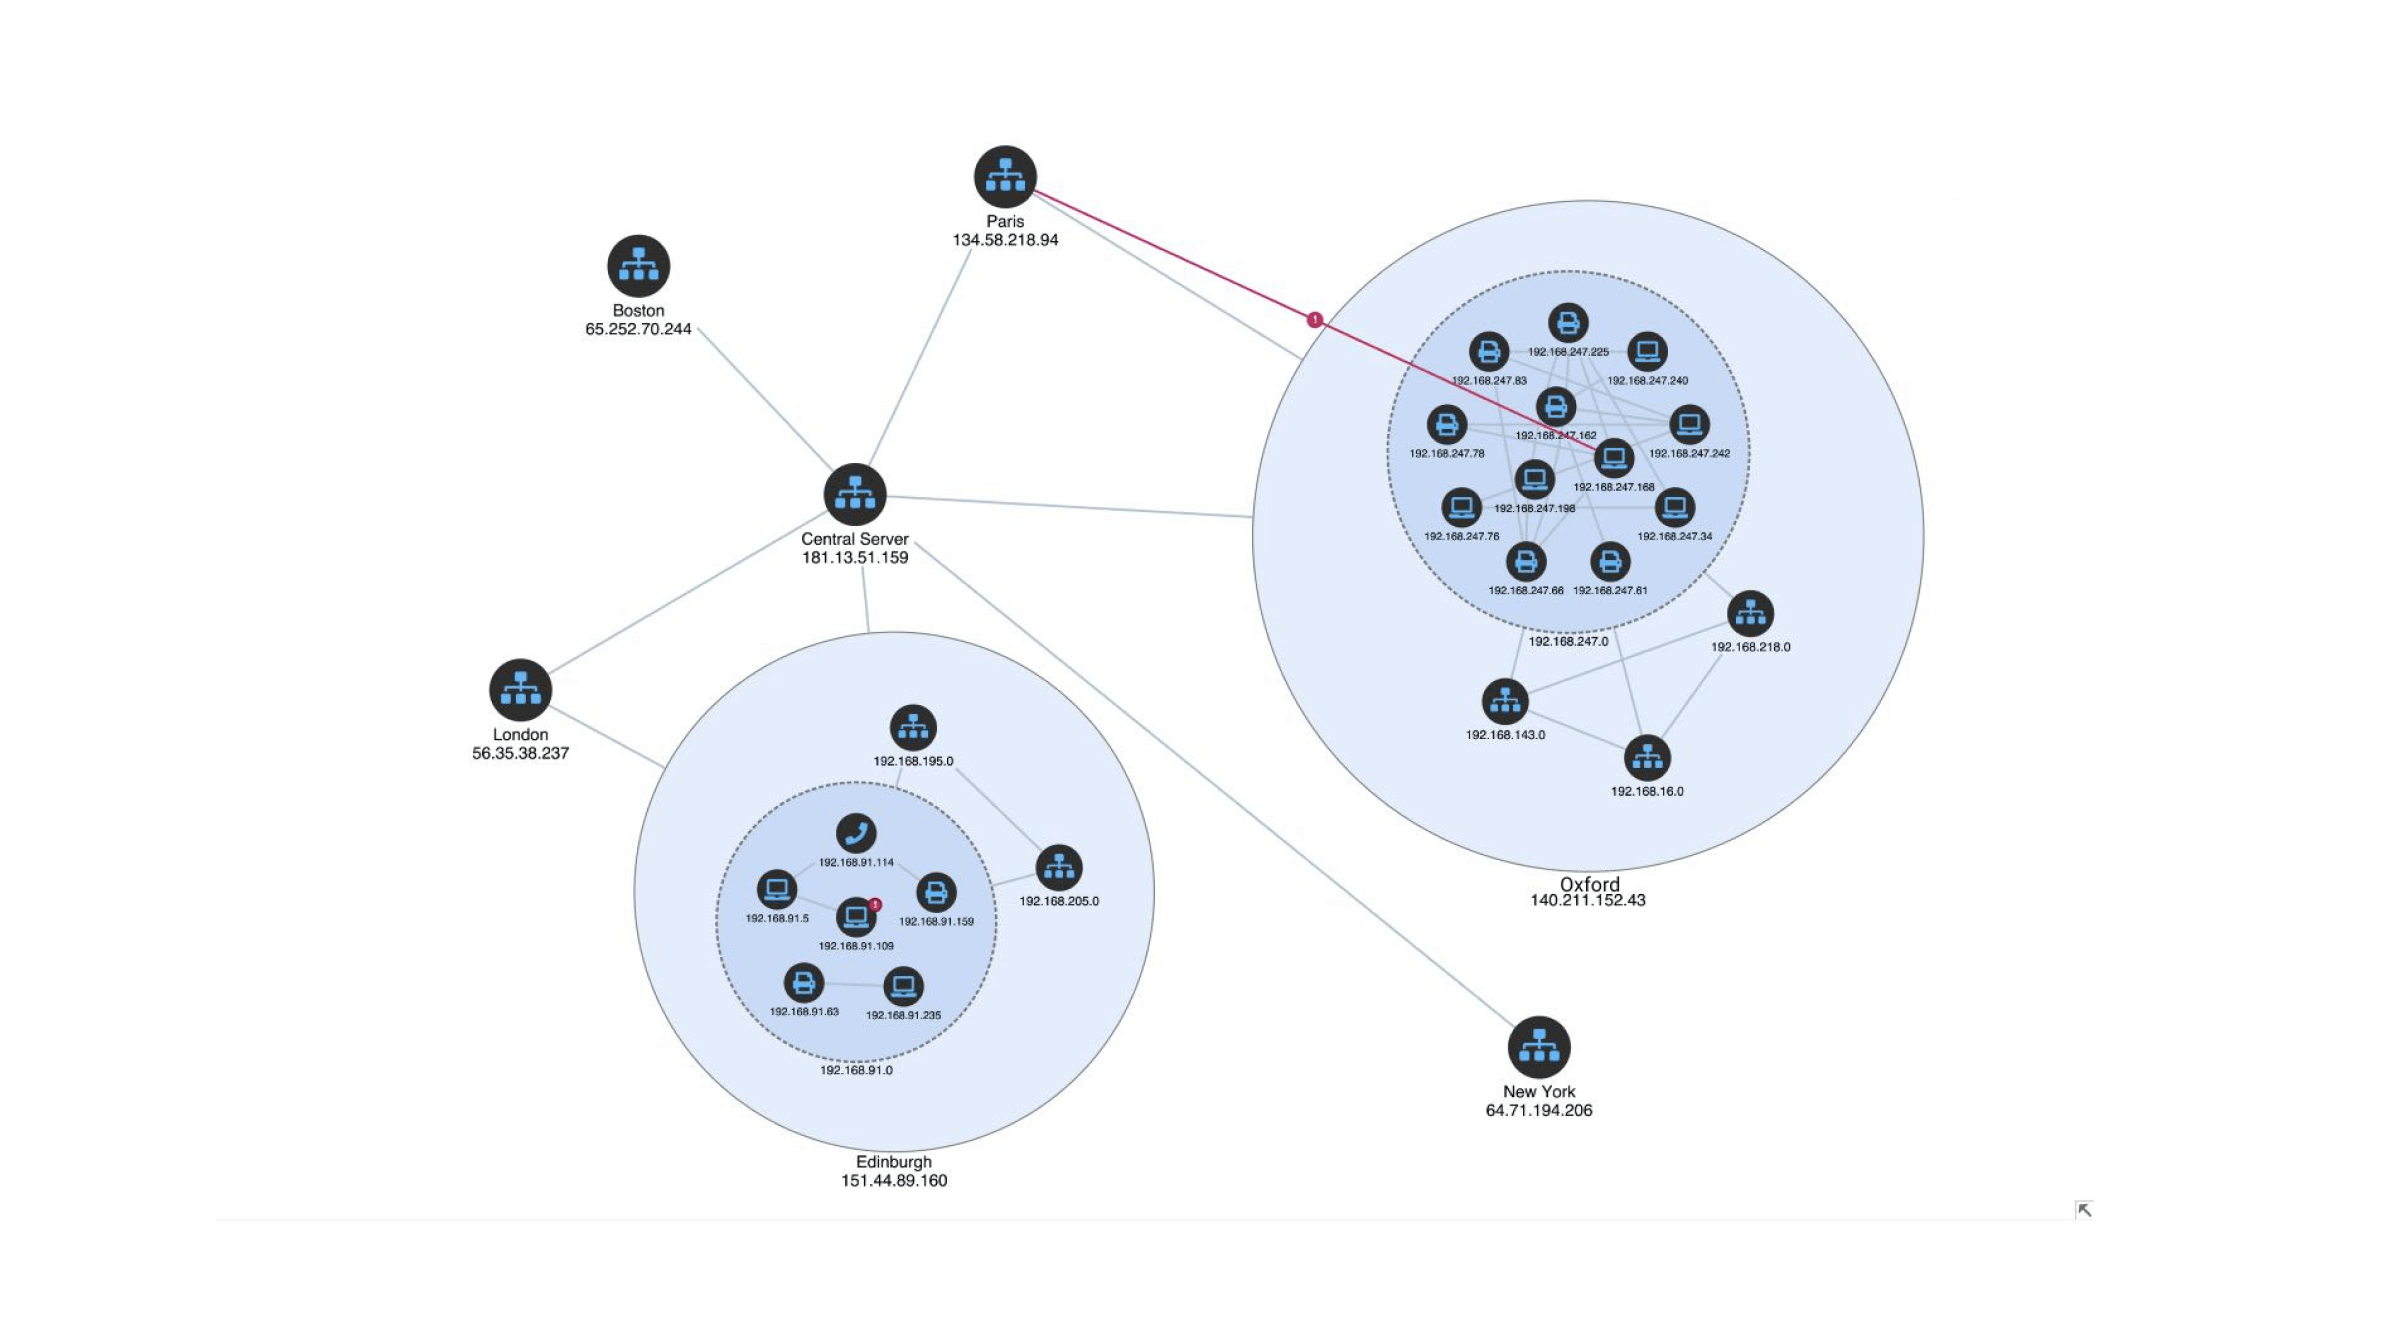
Source: Cambridge Intelligence
It models a network segmented across multiple locations, including Oxford, Edinburgh, Paris, and a central server. Within this structure, one internal IP (192.168.247.152) in the Oxford subnet communicates unexpectedly with an external node in Paris (134.58.218.94).
While other communication patterns remain localized, this red path suggests a potential breach point or exfiltration route. Betweenness Centrality flags 192.168.247.152 as a high-risk pivot node that, if compromised, could enable wide-ranging access across the environment.
By applying Betweenness Centrality, security teams can prioritize high-risk pivot nodes for immediate containment or review. This enables a clearer understanding of post-incident spread across segmented networks.
Turn Visibility Into Action
Breaches happen. What matters is how fast you see the lateral moves, trace the spread, and shut attackers out before they can do more damage.
Graph technology doesn’t just help you react. It helps you learn. It shows the real story behind an incident so the next time, you catch it sooner.
Attackers look for blind spots. Graphs help you close them.
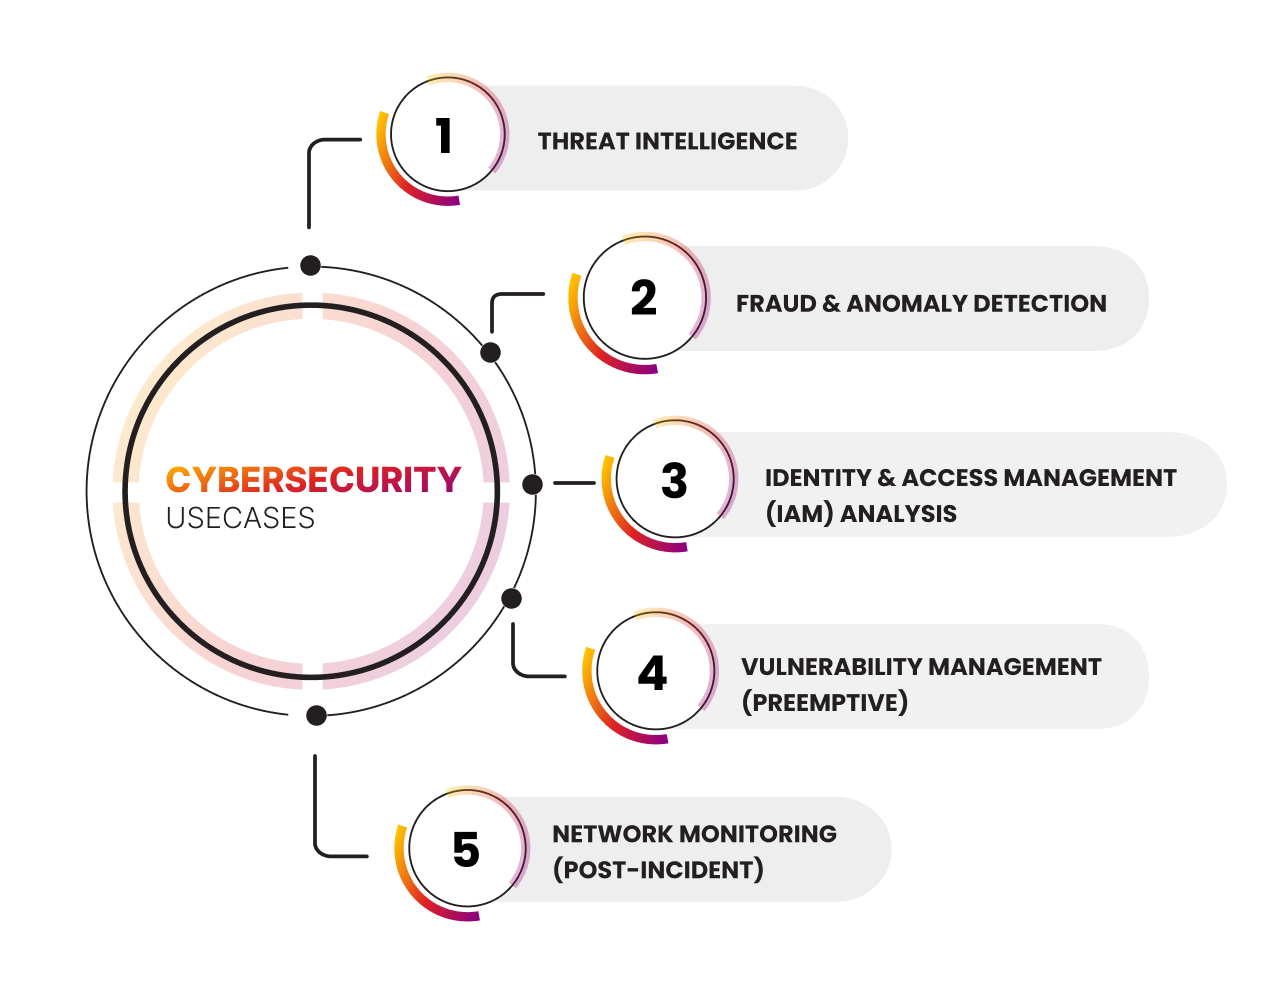
Want a deeper look at all five cybersecurity use cases enabled by graph technology?
Download the full Cybersecurity Guide to explore practical insights and research-backed techniques.