Introducing KNIME Extension: Low-Code Graph Analysis is here
Graph databases excel at representing information as it naturally exists in the world: interconnected entities with meaningful relationships instead of isolated tables. This network structure generates faster insights and more intuitive data exploration.
We're excited to announce that Memgraph's high-performance graph database capabilities are now available within KNIME Analytics Platform through a new extension developed by our partners at Redfield. This integration brings together Memgraph's in-memory processing power with KNIME's low-code environment, allowing you to analyse connected data without extensive coding.
This blog will:
- Explore what makes Memgraph unique
- Walk through the capabilities of our new KNIME extension
- Show you how to use shareable data preprocessing components
- Demonstrate a practical example of creating and analysing a cocktail database
Whether you're already using KNIME or looking for accessible ways to leverage graph analytics, this integration opens new possibilities for working with connected data.
What is KNIME Analytics Platform?
KNIME, the Konstanz Information Miner, is an open-source data analytics platform designed to make working with data more accessible through visual, no-code, drag-and-drop interface. This makes KNIME particularly useful for teams working with structured and semi-structured data who want to move quickly from data preparation to analysis, without writing and maintaining complex codebases.
Thanks to its extensible nature, KNIME now supports graph data processing through dedicated extensions. One of those is the new Memgraph extension, which lets you query a Memgraph database using Cypher directly within a KNIME workflow and integrate graph data with the rest of your analytics pipeline. When combined with graph data, KNIME enables you to analyze, visualise, and understand relationships within datasets represented as nodes and edges in a graph structure.
The Memgraph Extension for KNIME
Our new Memgraph extension for KNIME Analytics Platform lets you integrate Memgraph databases into your workflows without extensive coding. The extension includes three essential nodes:
1: Memgraph Connection Node
- Establishes a connection using the native BOLT protocol
- Requires only URL, username, and password (can use your KNIME credentials)
- Define the number of parallel connections (by default, equal to the number of CPU threads)
Once configured, this node connects KNIME to Memgraph so other nodes can send and receive data.
 The Memgraph Connection node
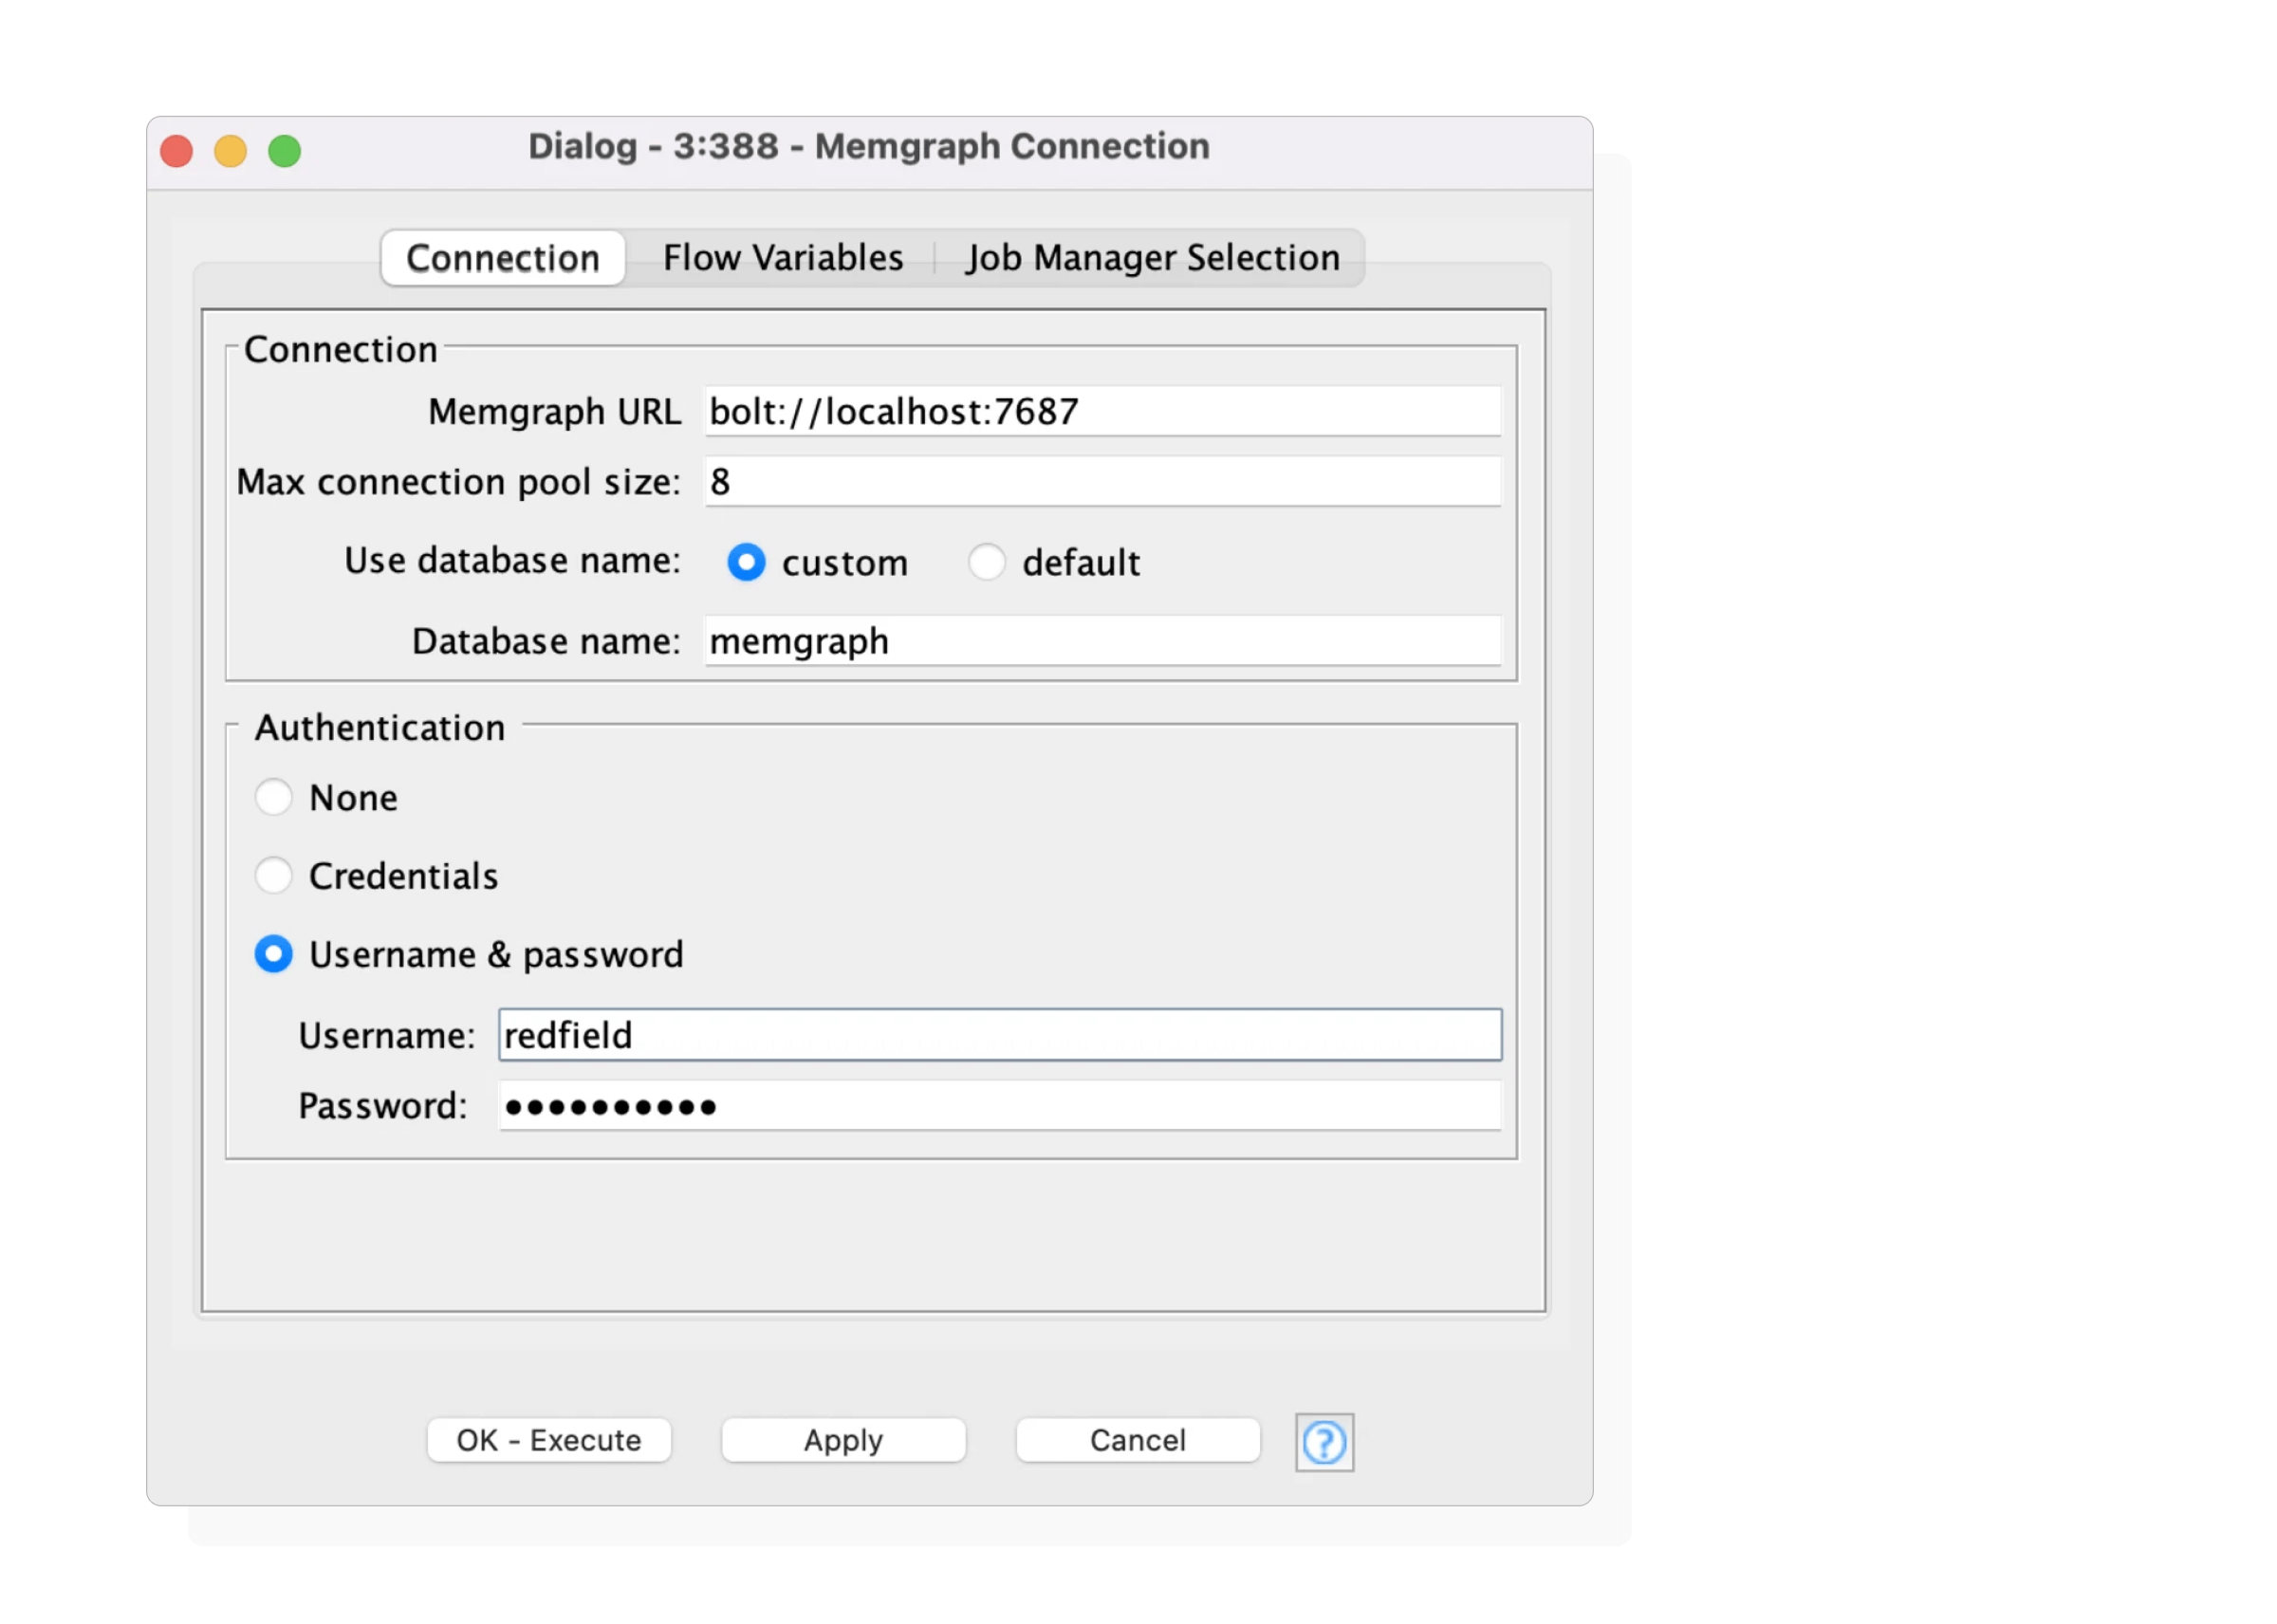 The configuration dialog for the Memgraph Connection node
2: Memgraph Writer Node
Use this node to insert data into Memgraph from within KNIME. It supports two modes:
- Script Mode: Define Cypher queries manually and enrich them using node and relationship labels, properties, Memgraph functions, and flow variables. You can inject any of these components directly into the script by double-clicking them in the configuration panel.
- Table Mode: Automate query execution by activating the dynamic port and feeding in a table of Cypher queries (from a string column node). Queries can be executed in parallel (asynchronous) or sequentially, one after another. For large-scale inserts, asynchronous mode generally offers better performance. However, if execution order matters, you can disable the asynchronous checkbox.
 The Memgraph Writer node
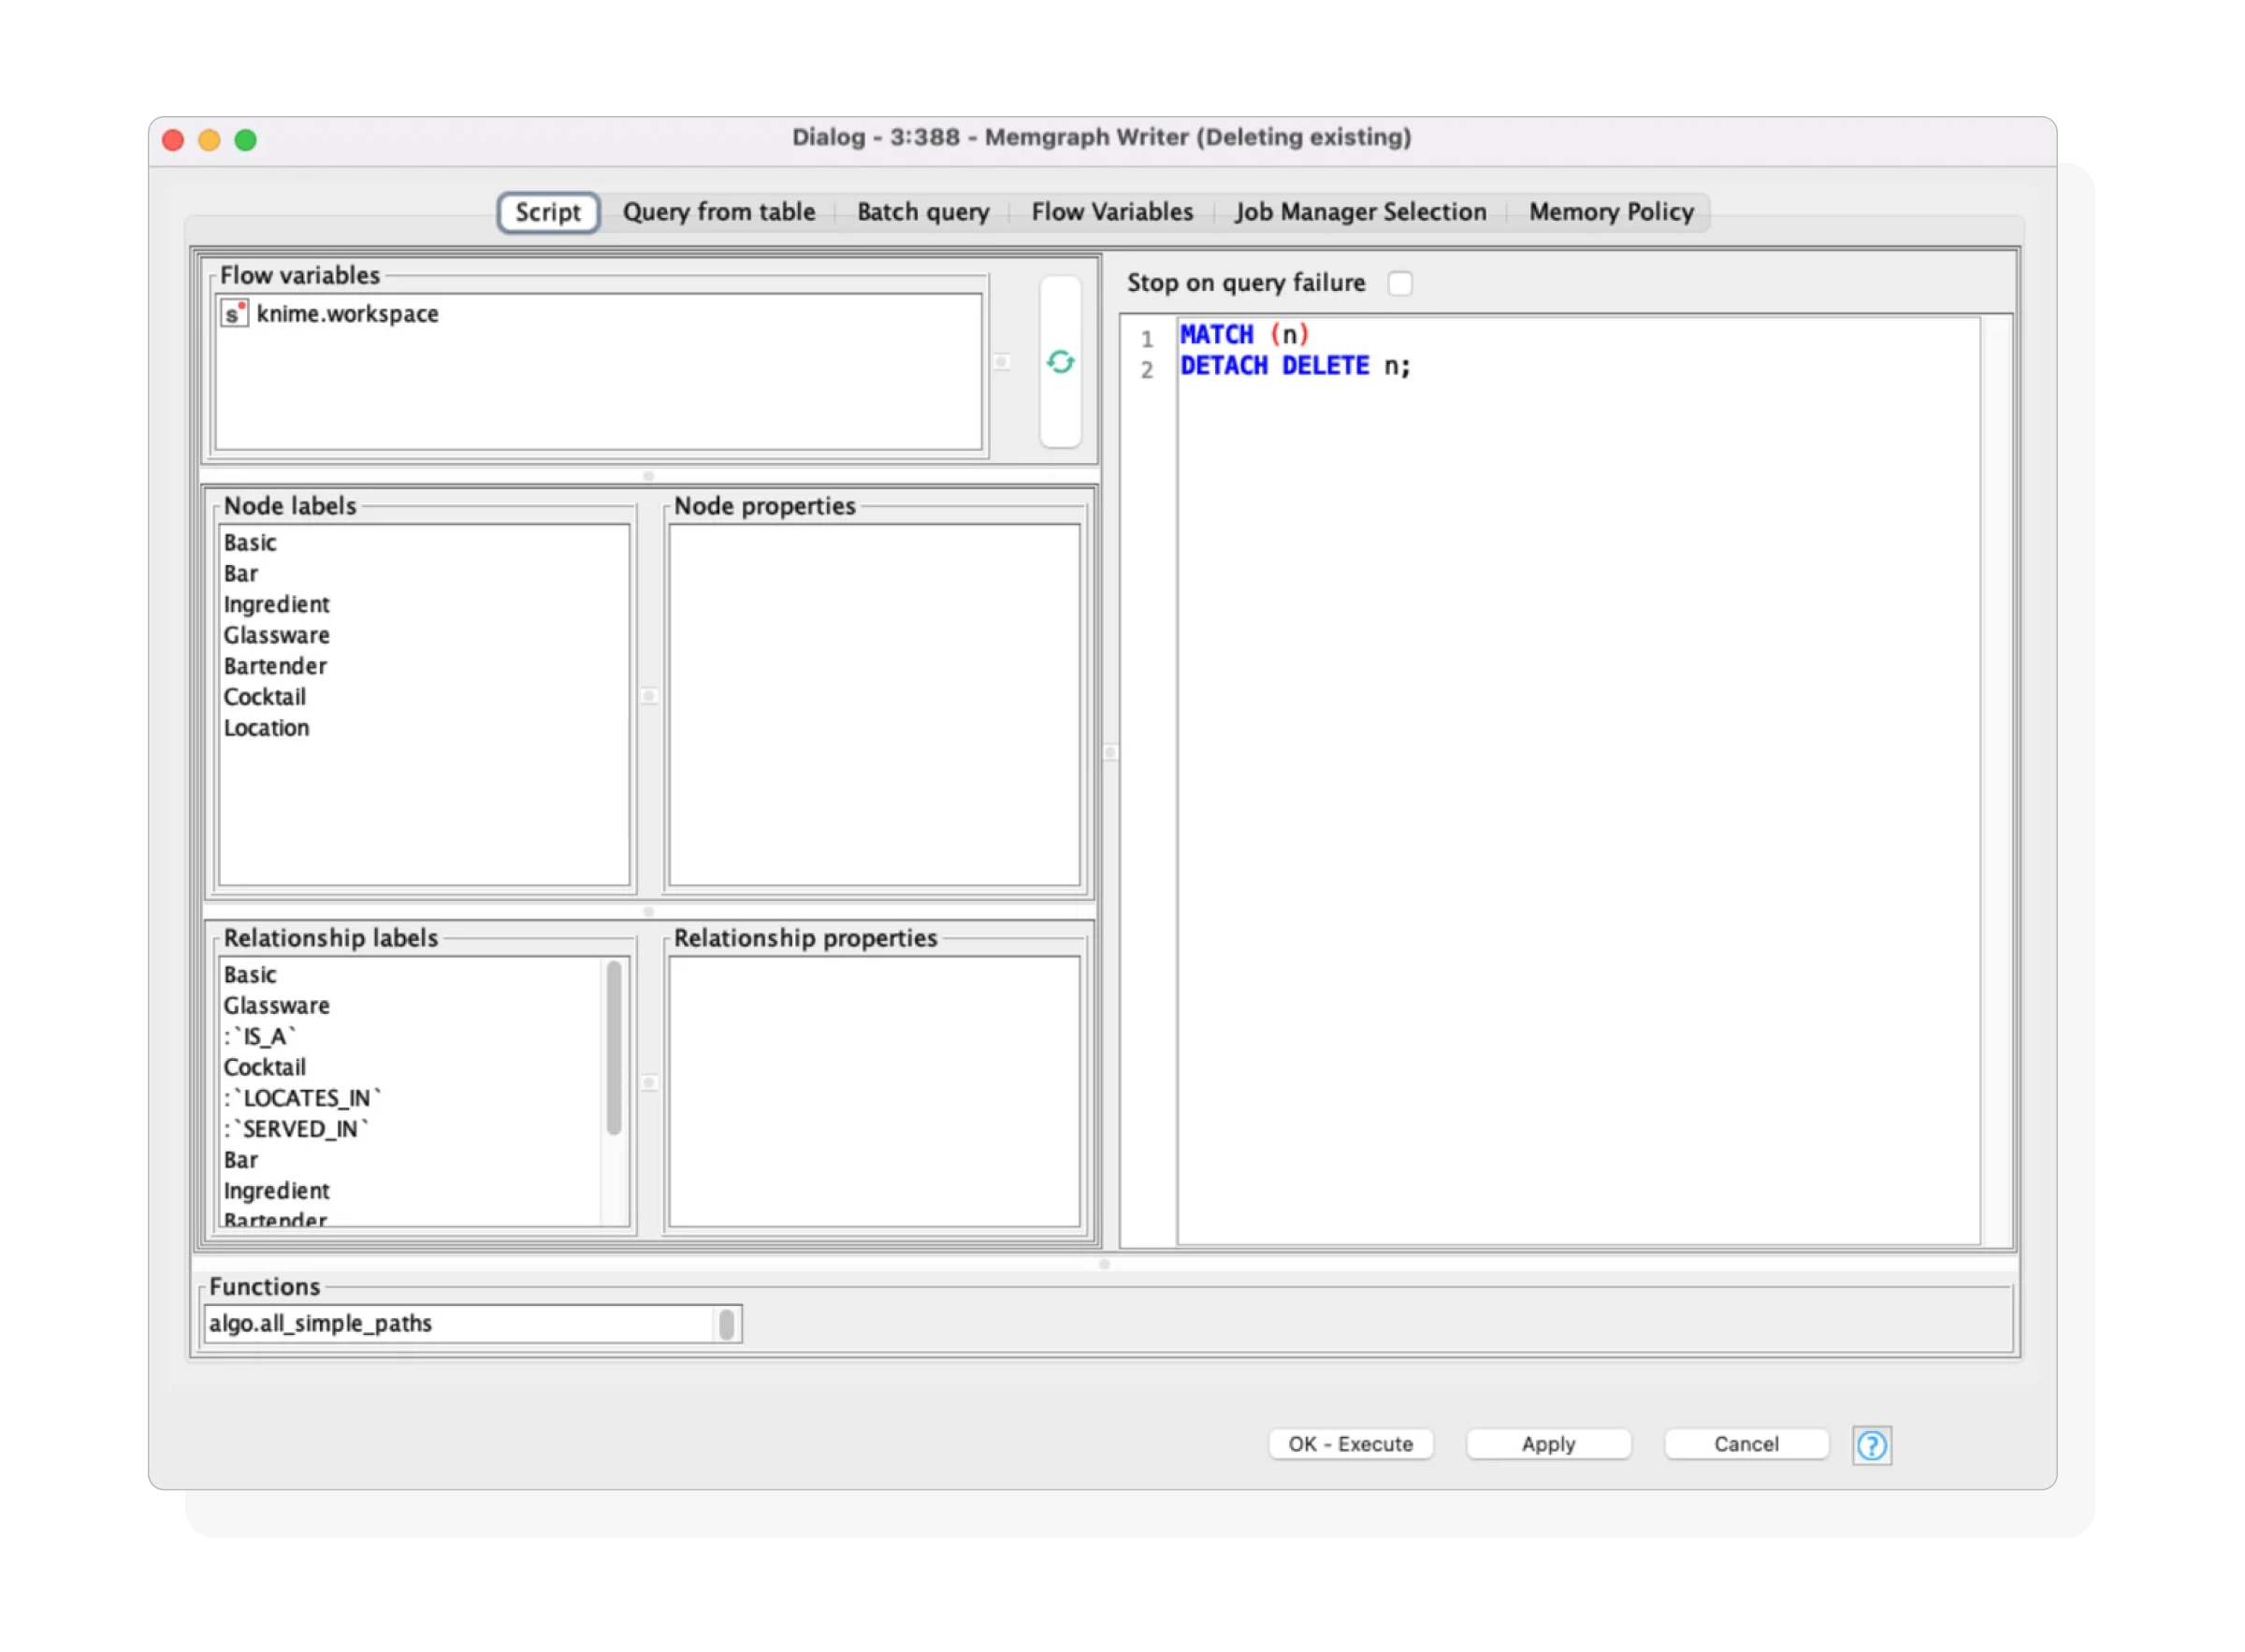 The Script Mode settings in the Memgraph Writer node
3: Memgraph Reader Node
This node retrieves data from Memgraph using Cypher queries for analysis.
- Extracts data from Memgraph with similar configuration options to the Writer node (supports Script Mode and Table Mode)
- It automatically maps Memgraph data types (e.g. String, Integer, Float, Date, List) to compatible KNIME types
- If your query returns complex data structures, you can enable the JSON output mode and parse the results later using KNIME’s JSON Path node.
 The Memgraph Reader node
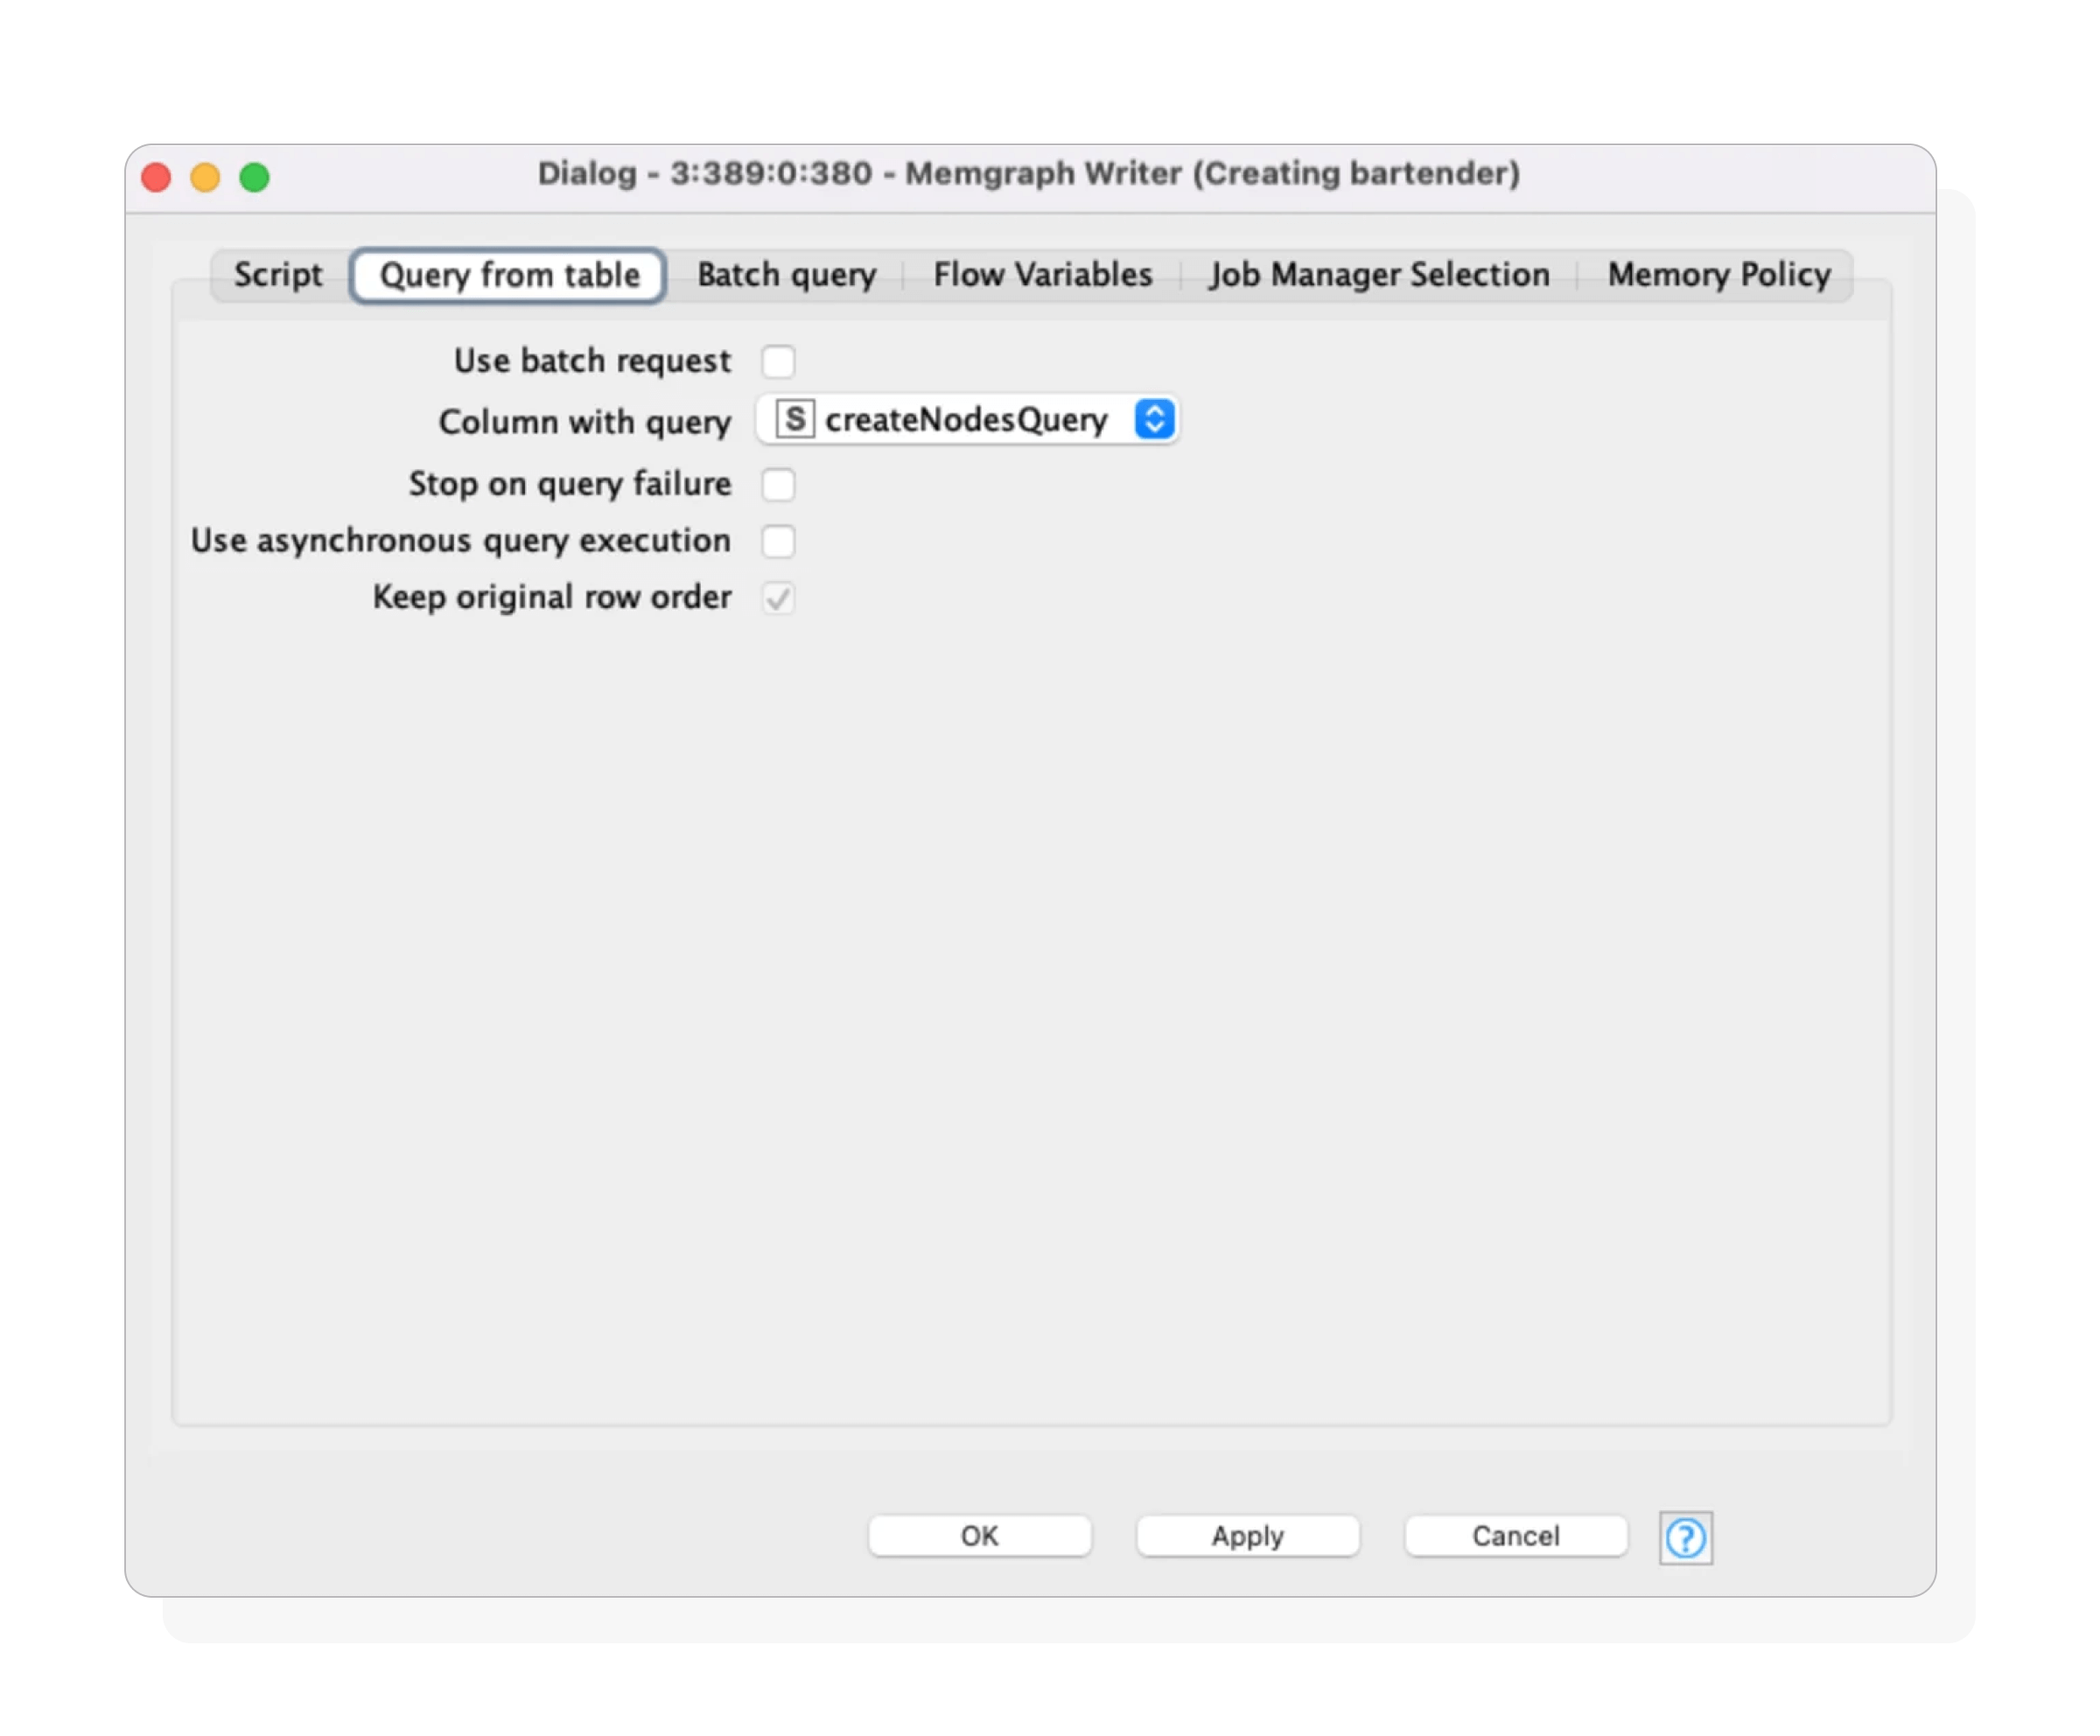 A query in the Table Mode of the Memgraph Writer node
Building a Cocktail Graph Database
To demonstrate how this extension works in practice, Redfield built a graph database of cocktail data from a public Kaggle dataset.
The dataset includes:
- Cocktail ingredients
- Bars serving cocktails
- Bartenders who serve cocktails
- Glassware for different cocktails
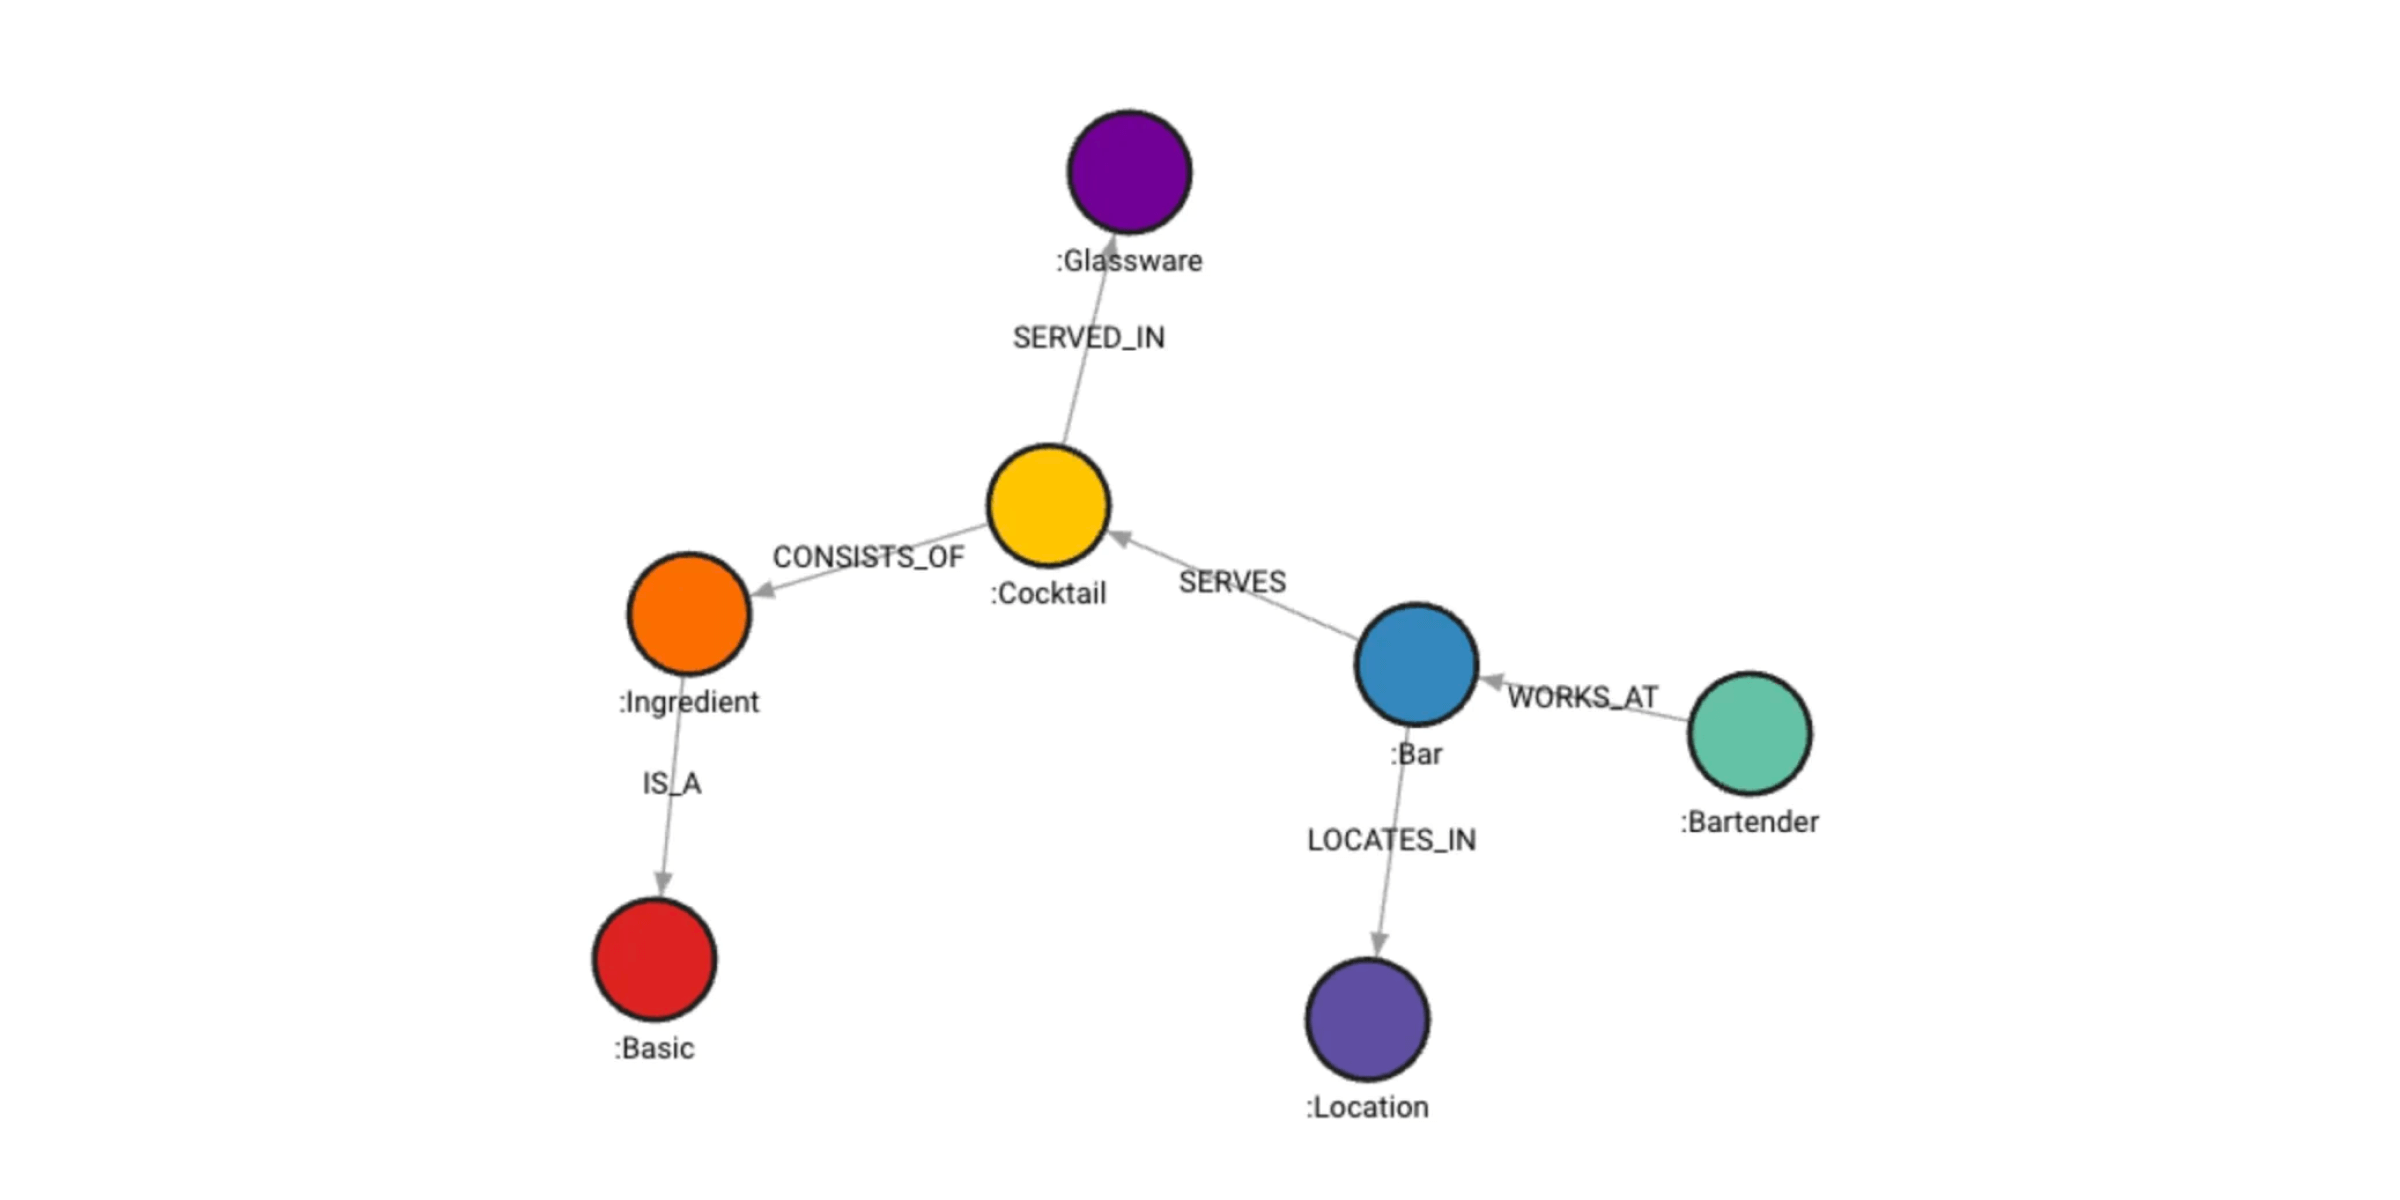 The cocktail graph scheme: Bartenders work at bars located in various cities. These bars serve cocktails in specific glassware. Each cocktail consists of ingredients (not specified in this schema)
 Datasets always require some preprocessing before we can use the data. For this example, we had to:
Step 1: Data Preparation and Import
- Clean column names for consistency
- Remove missing or invalid values from the cocktail ingredients
- Convert raw tables into nodes and relationships
ETL Made Easy: Shareable Components for Memgraph
Preprocessing is a tedious but necessary part of data analytics. Redfield has developed a set of components to help you generate Cypher queries for creating nodes (entities) and relationships efficiently.
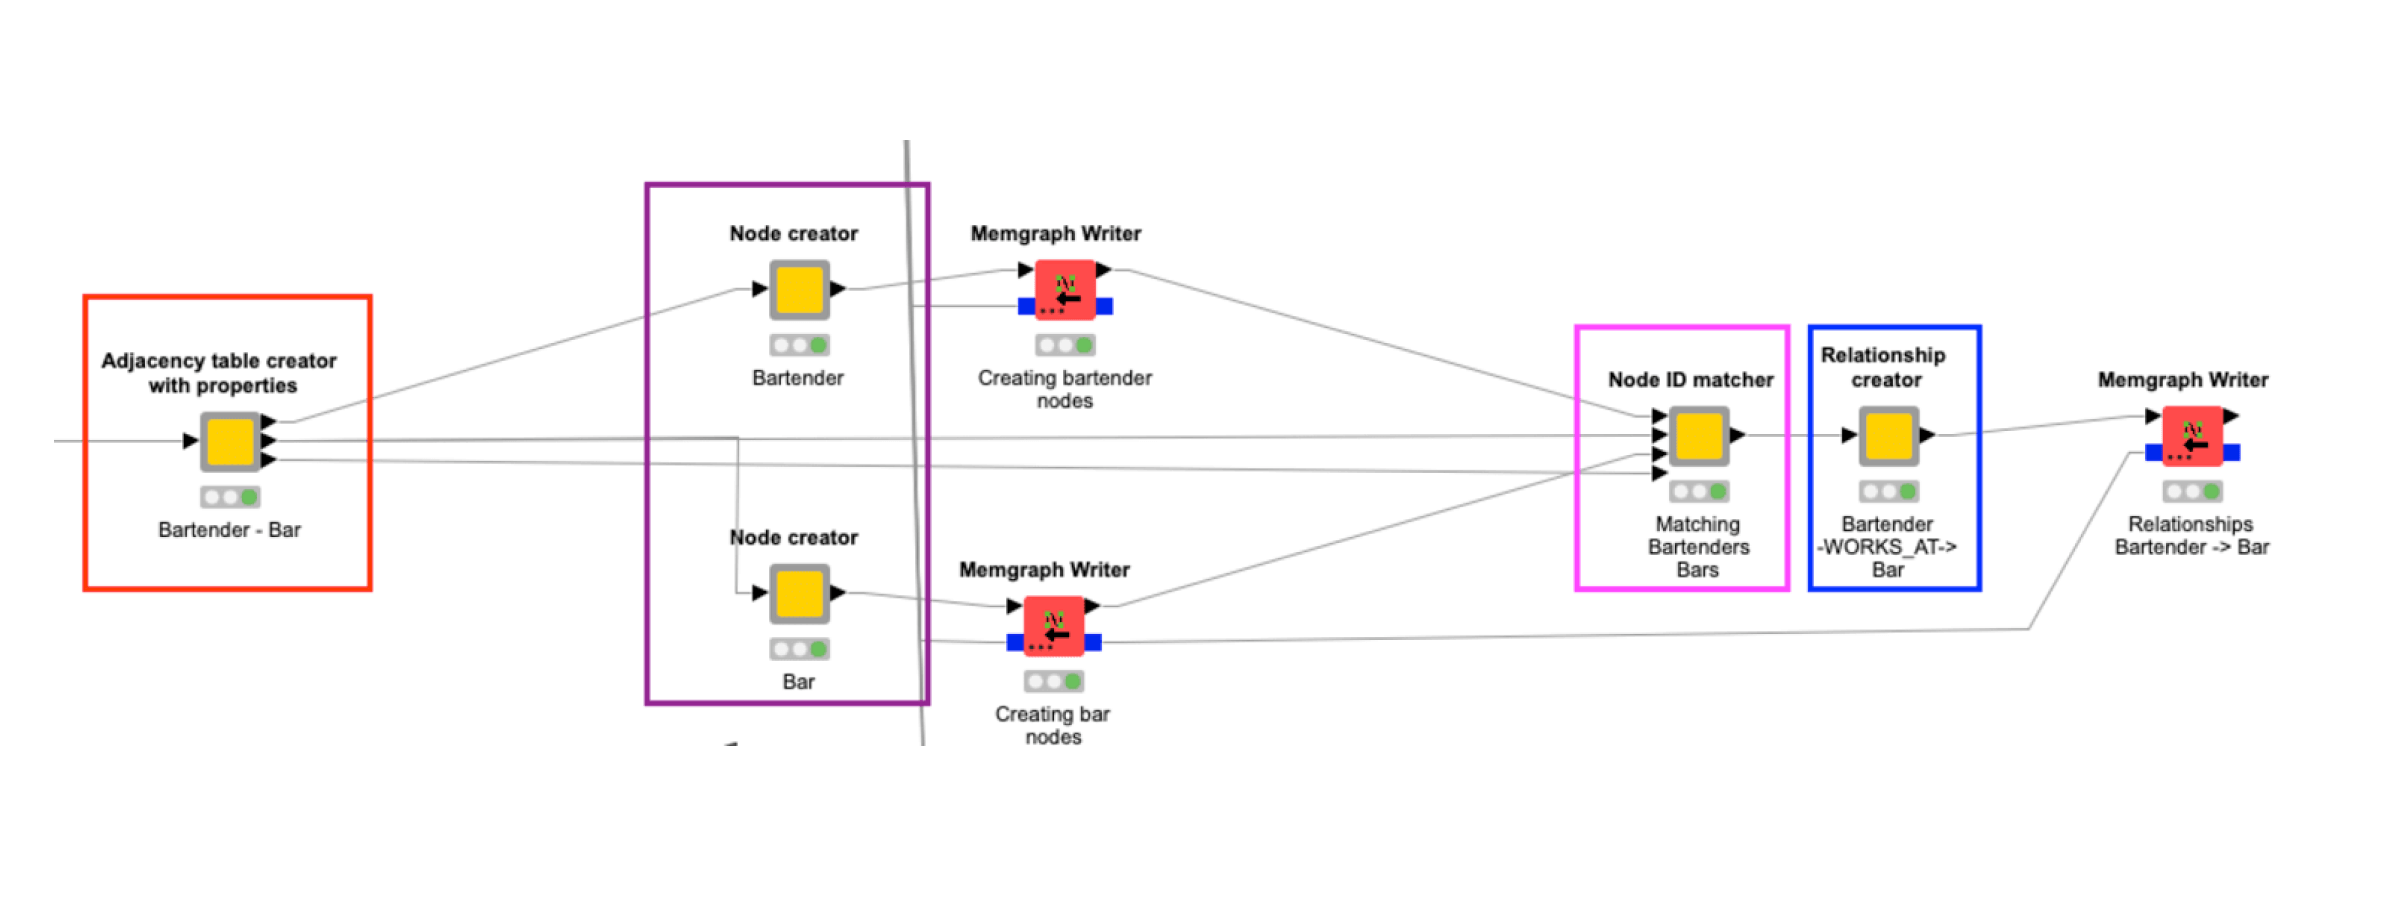 The workflow includes components designed to efficiently generate Cypher queries for creating nodes and relationships.
→ Component 1: Adjacency Table Creator with Properties
Generates three intermediate tables that serve as the foundation for constructing Cypher queries for nodes and relationships:
- Aggregated table for future source nodes with lists of their consecutive target nodes
- Aggregated table for future target nodes with lists of their consecutive source nodes
- Column names for source and target nodes to help create relationships
→ Component 2: Node Creator
The output from the Adjacency Table Creator is used to generate Cypher queries for creating nodes and their properties.
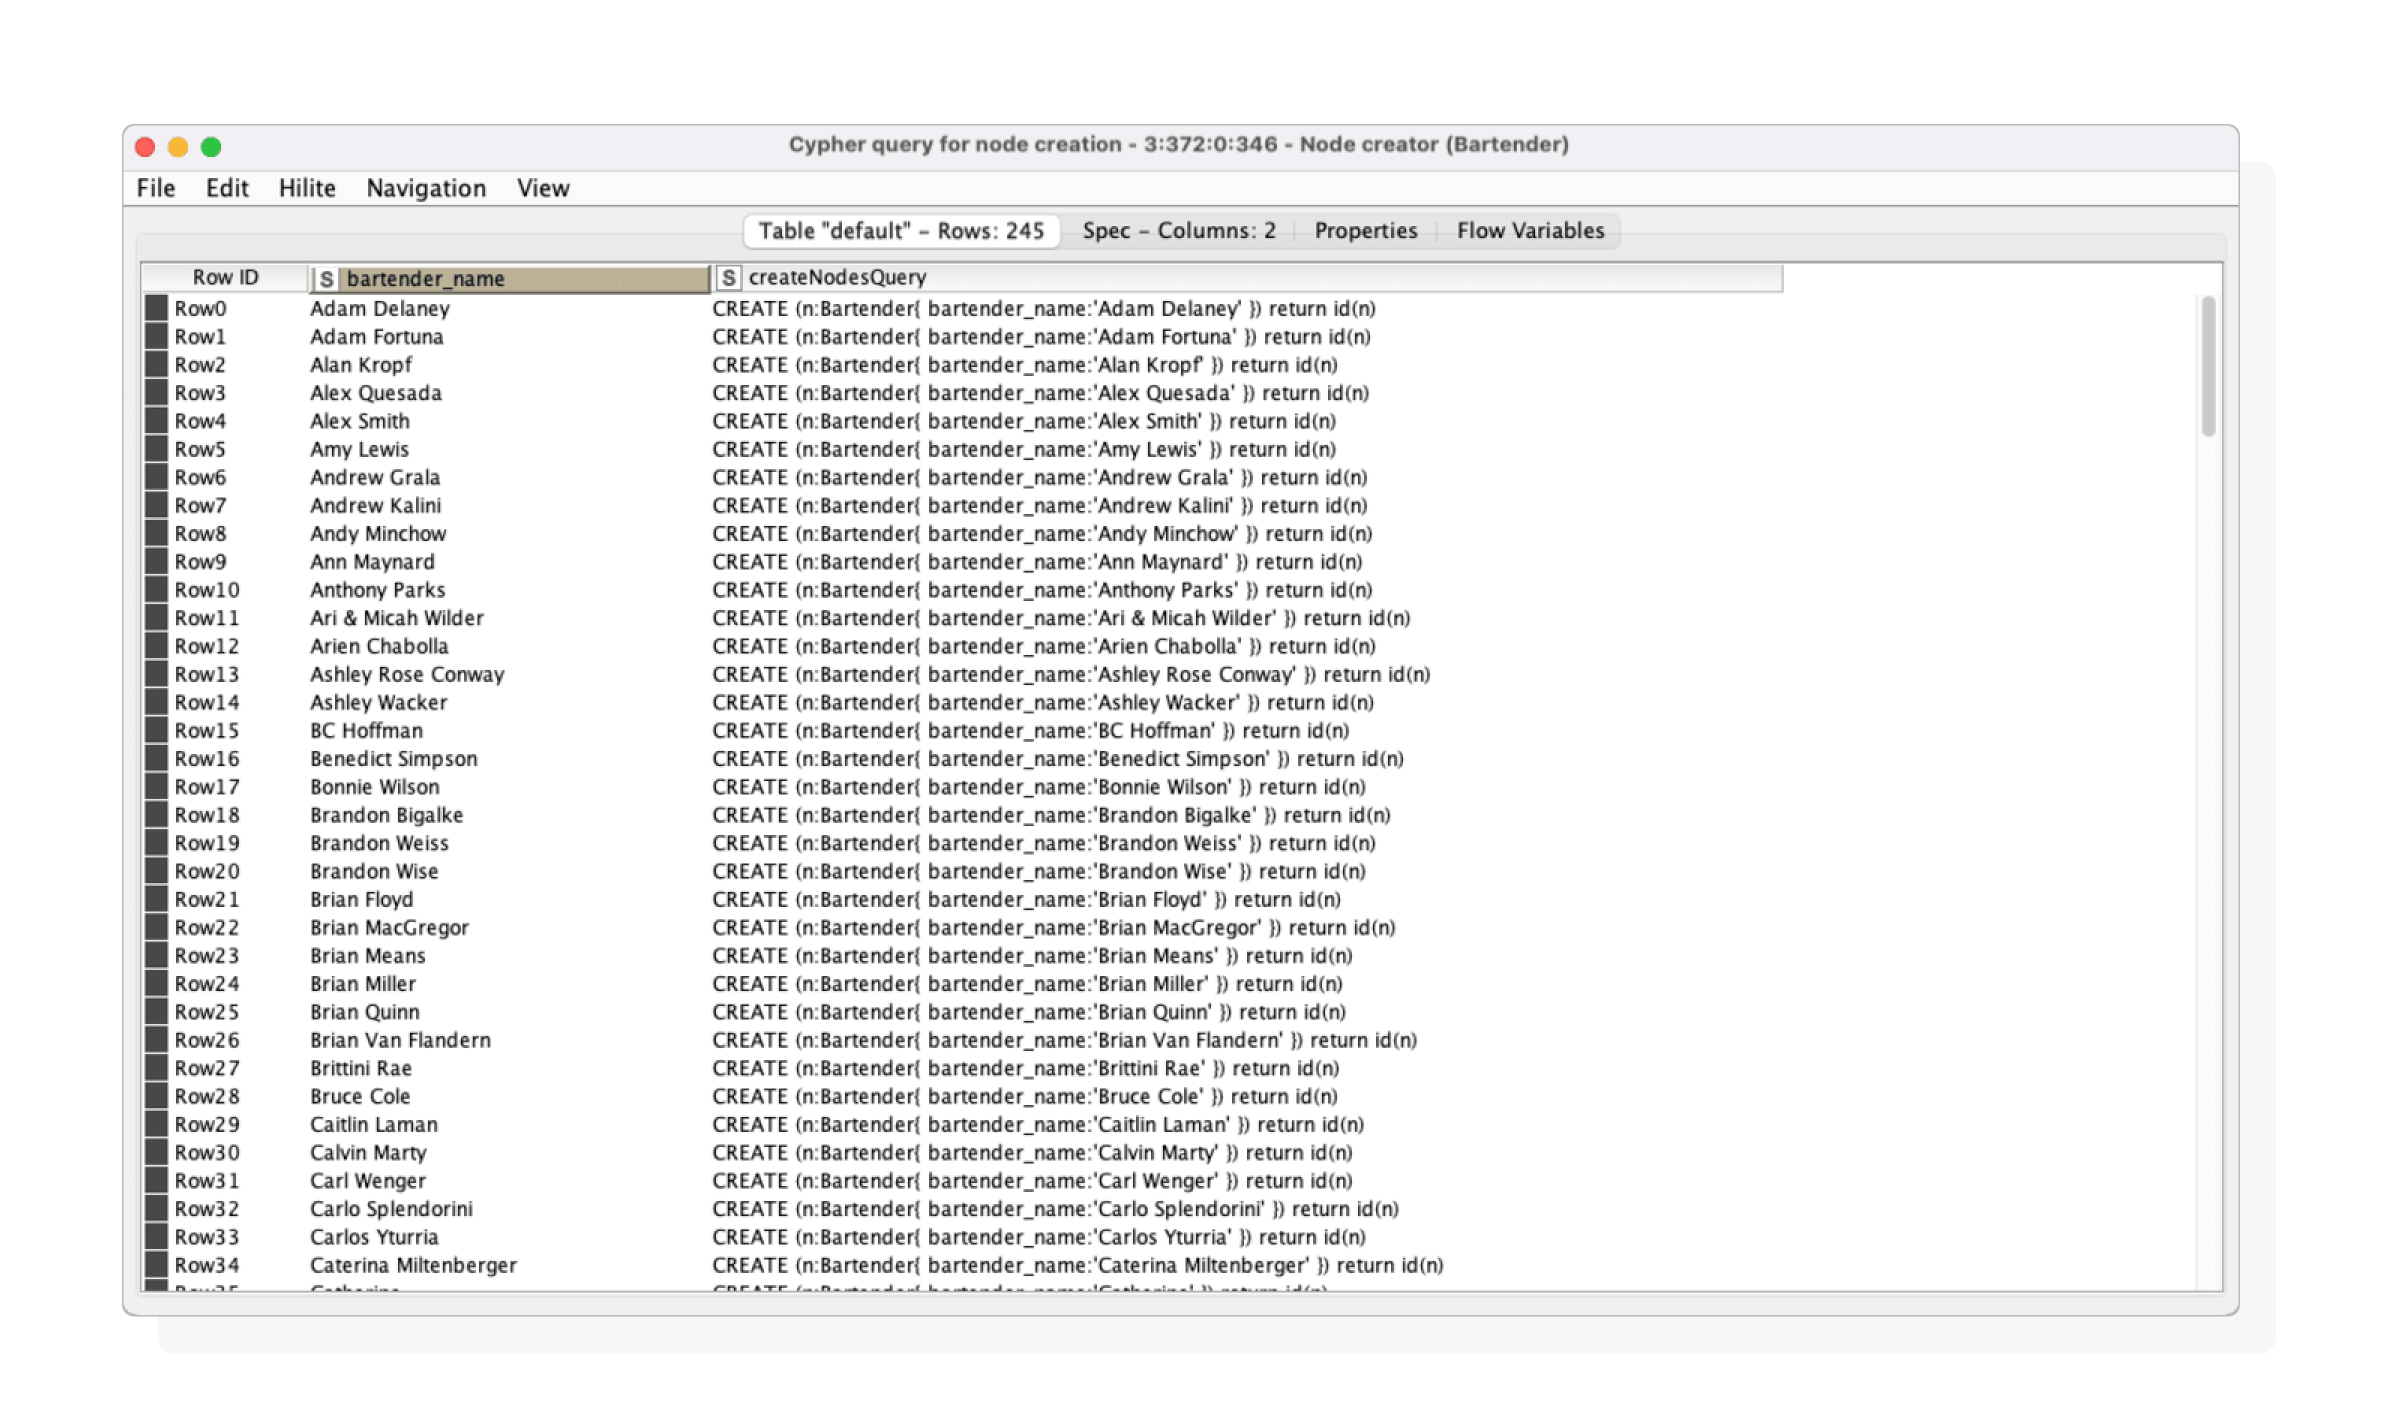 Node creator output
The result is a table containing the selected node properties and corresponding Cypher queries, which is then passed to the Memgraph Writer node for asynchronous execution.
→ Component 3: Node ID Matcher
This component matches (joins) source and target node IDs, which is essential for establishing relationships between entities in Memgraph.
→ Component 4: Relationship Creator
Takes the matched data and creates Cypher queries that define relationships between nodes, then passes them to the Writer Node for execution in the Memgraph database.
 Relationship creator output
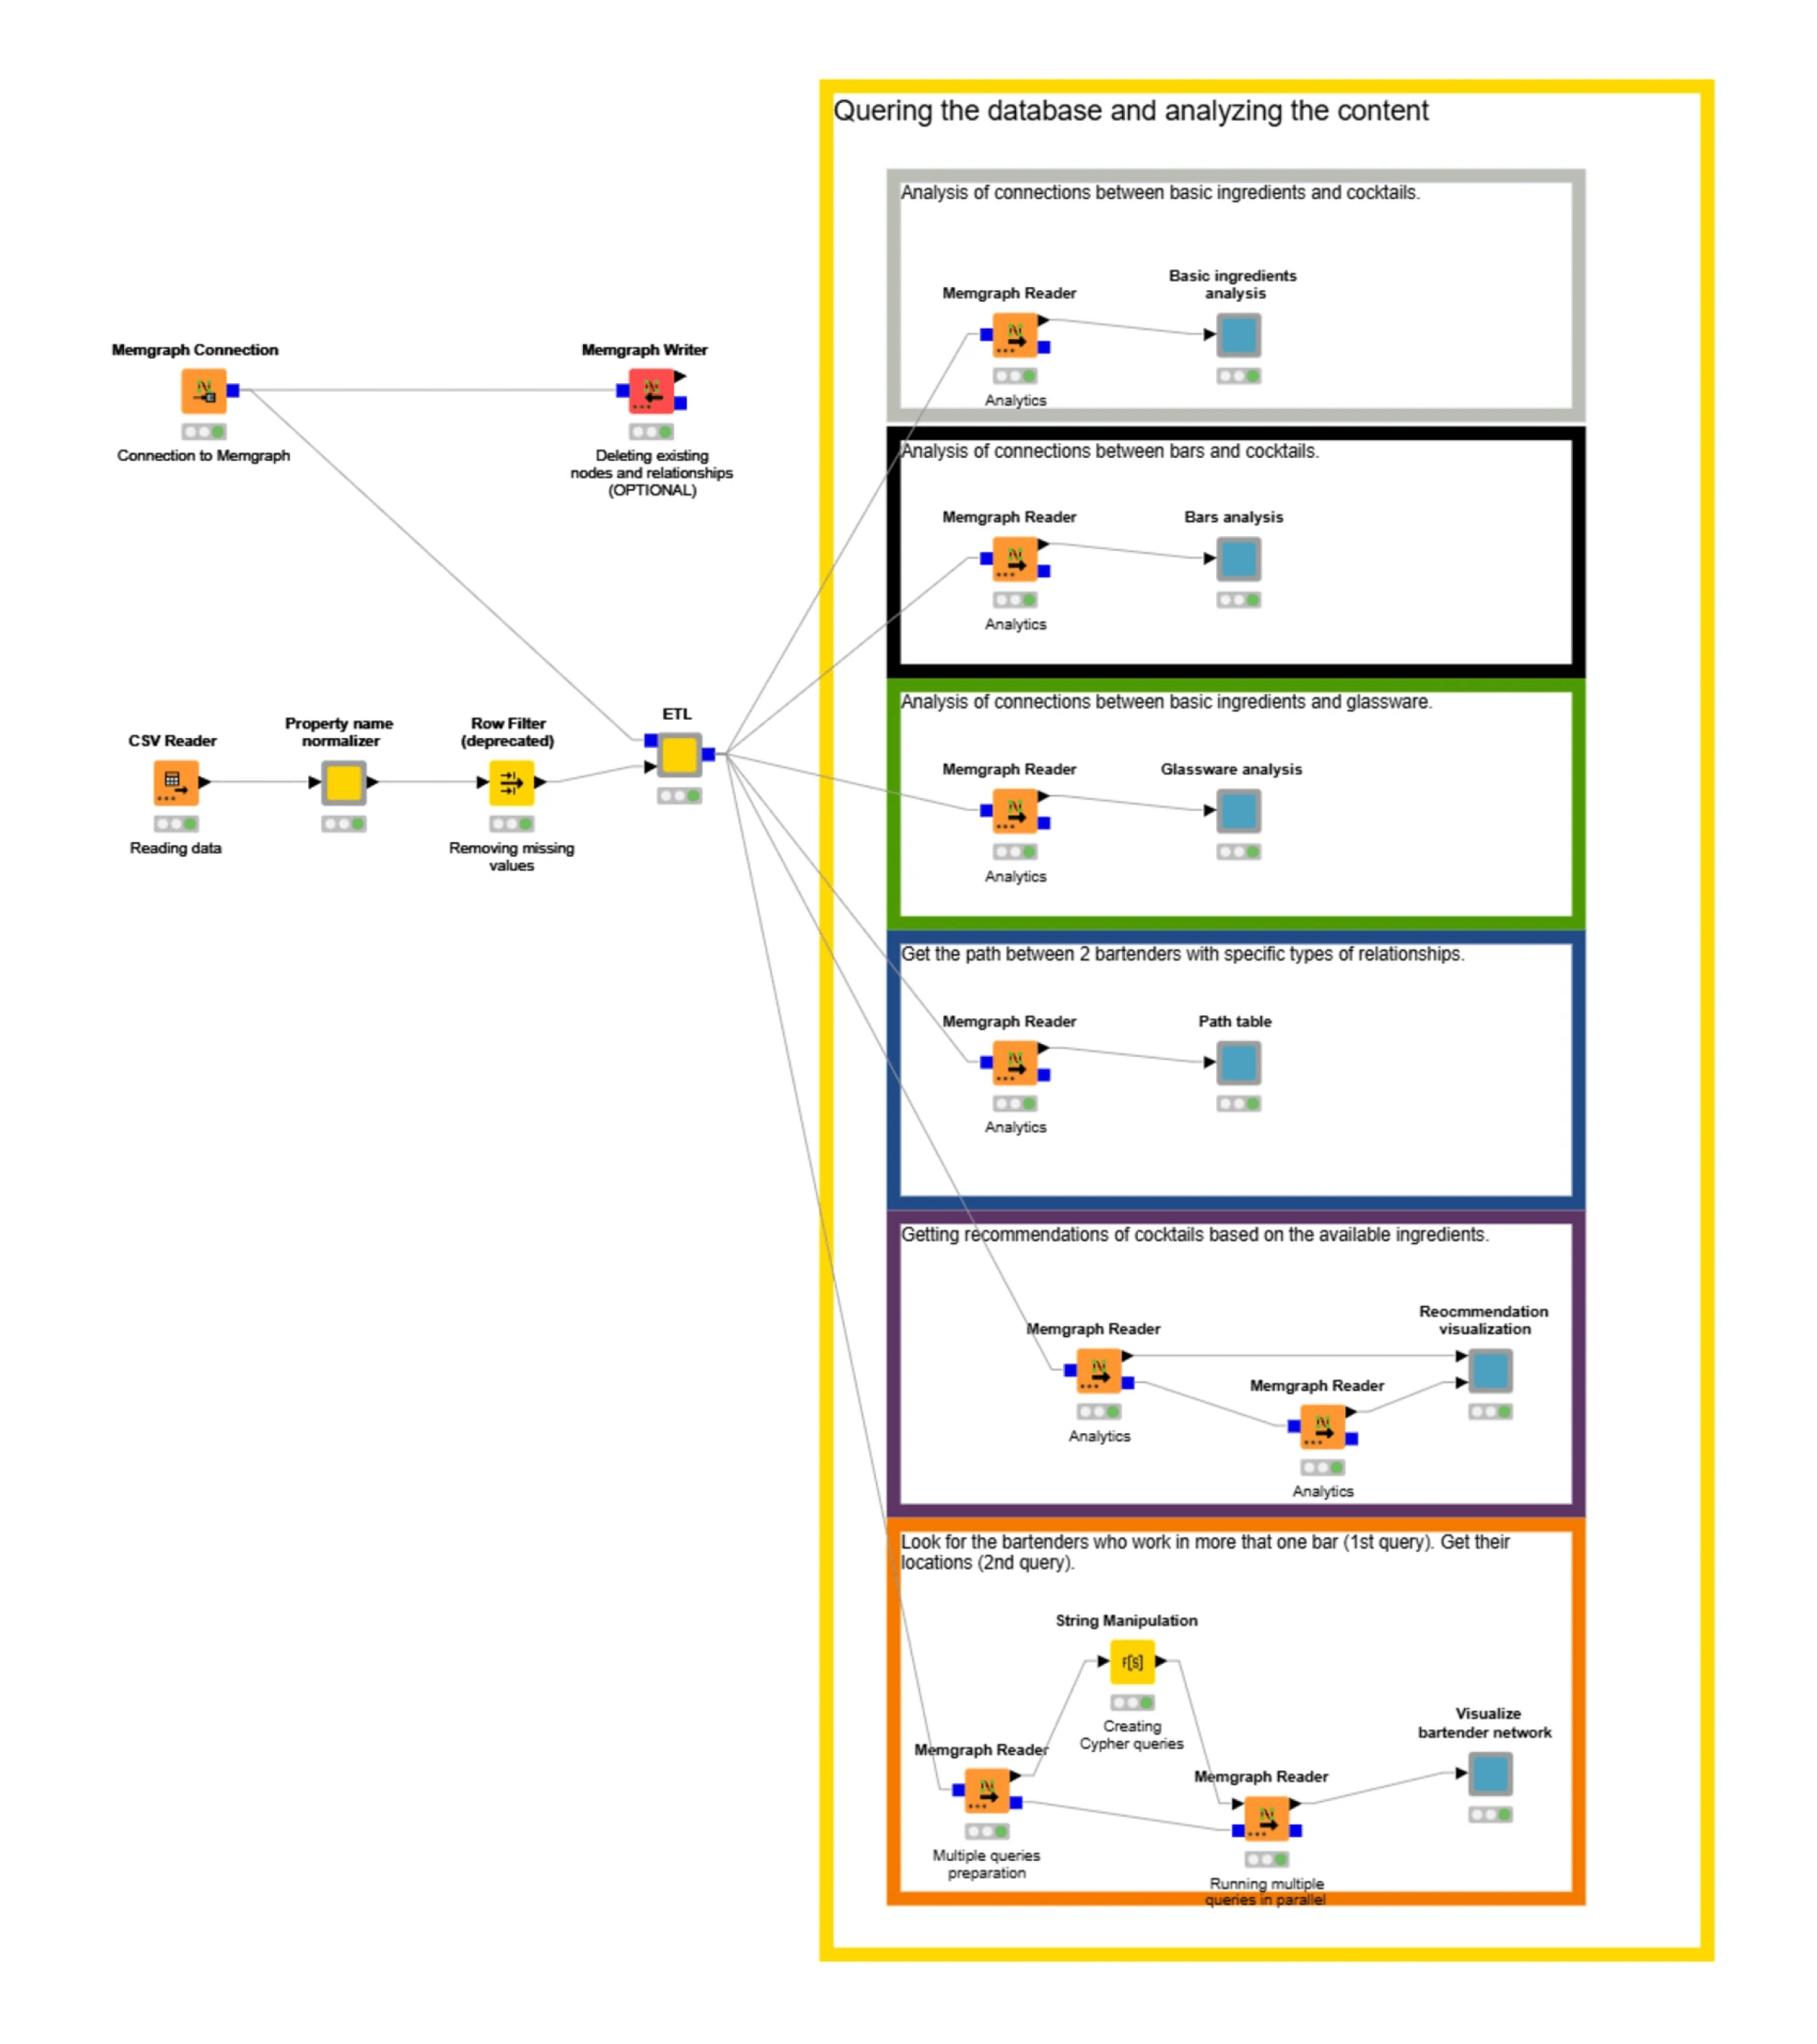
Step 2: Analysing the Graph in KNIME
With our data loaded into Memgraph, we'll use KNIME to perform analysis. This includes exploring entity relationships and applying standard aggregations methods to visualize the results.
Graph Analysis Use Cases in KNIME with Memgraph
Now, lets examine six practical use cases from the cocktail graph demo that show what's possible when combining Memgraph's real-time graph capabilities with KNIME's analytics tools:
Use Case 1: Find the Most Common Ingredients
We analysed cocktail-ingredient relationships to identify and visualise the top 10 most frequent ingredients in the form of a pie chart.
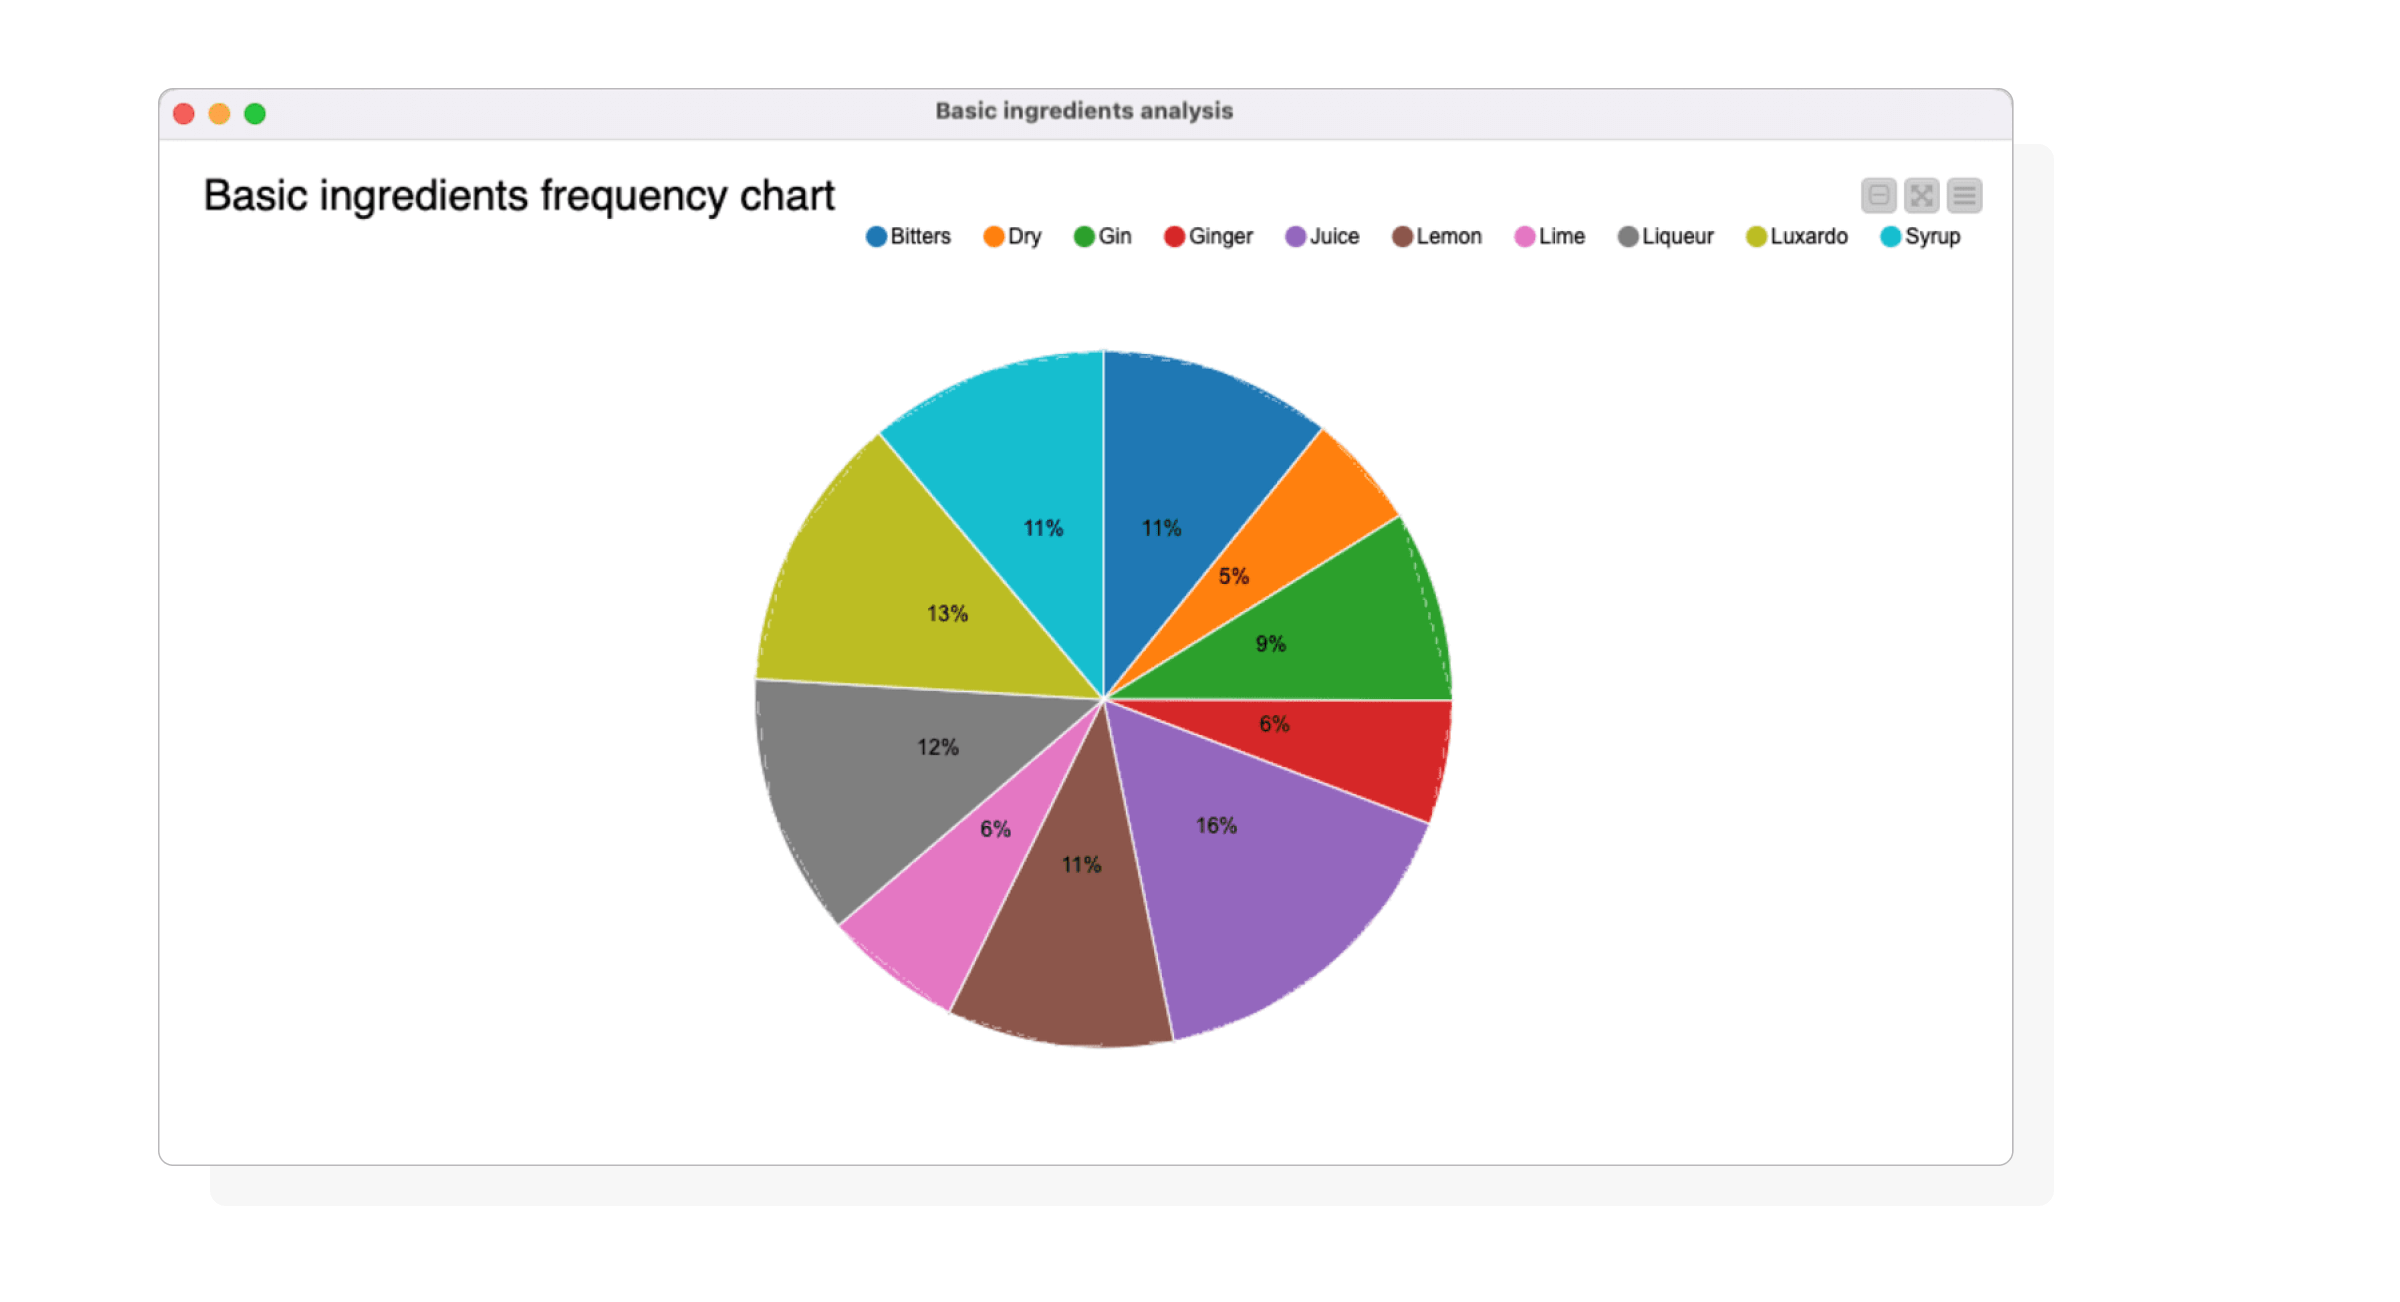 Visualisation by Basic ingredients analysis component.
Use Case 2: Match Bars with Ingredients
To improve bar menus, we examined ingredient availability. Our radar plot, displaying bars with over 29 ingredients, highlighted significant usage gaps.
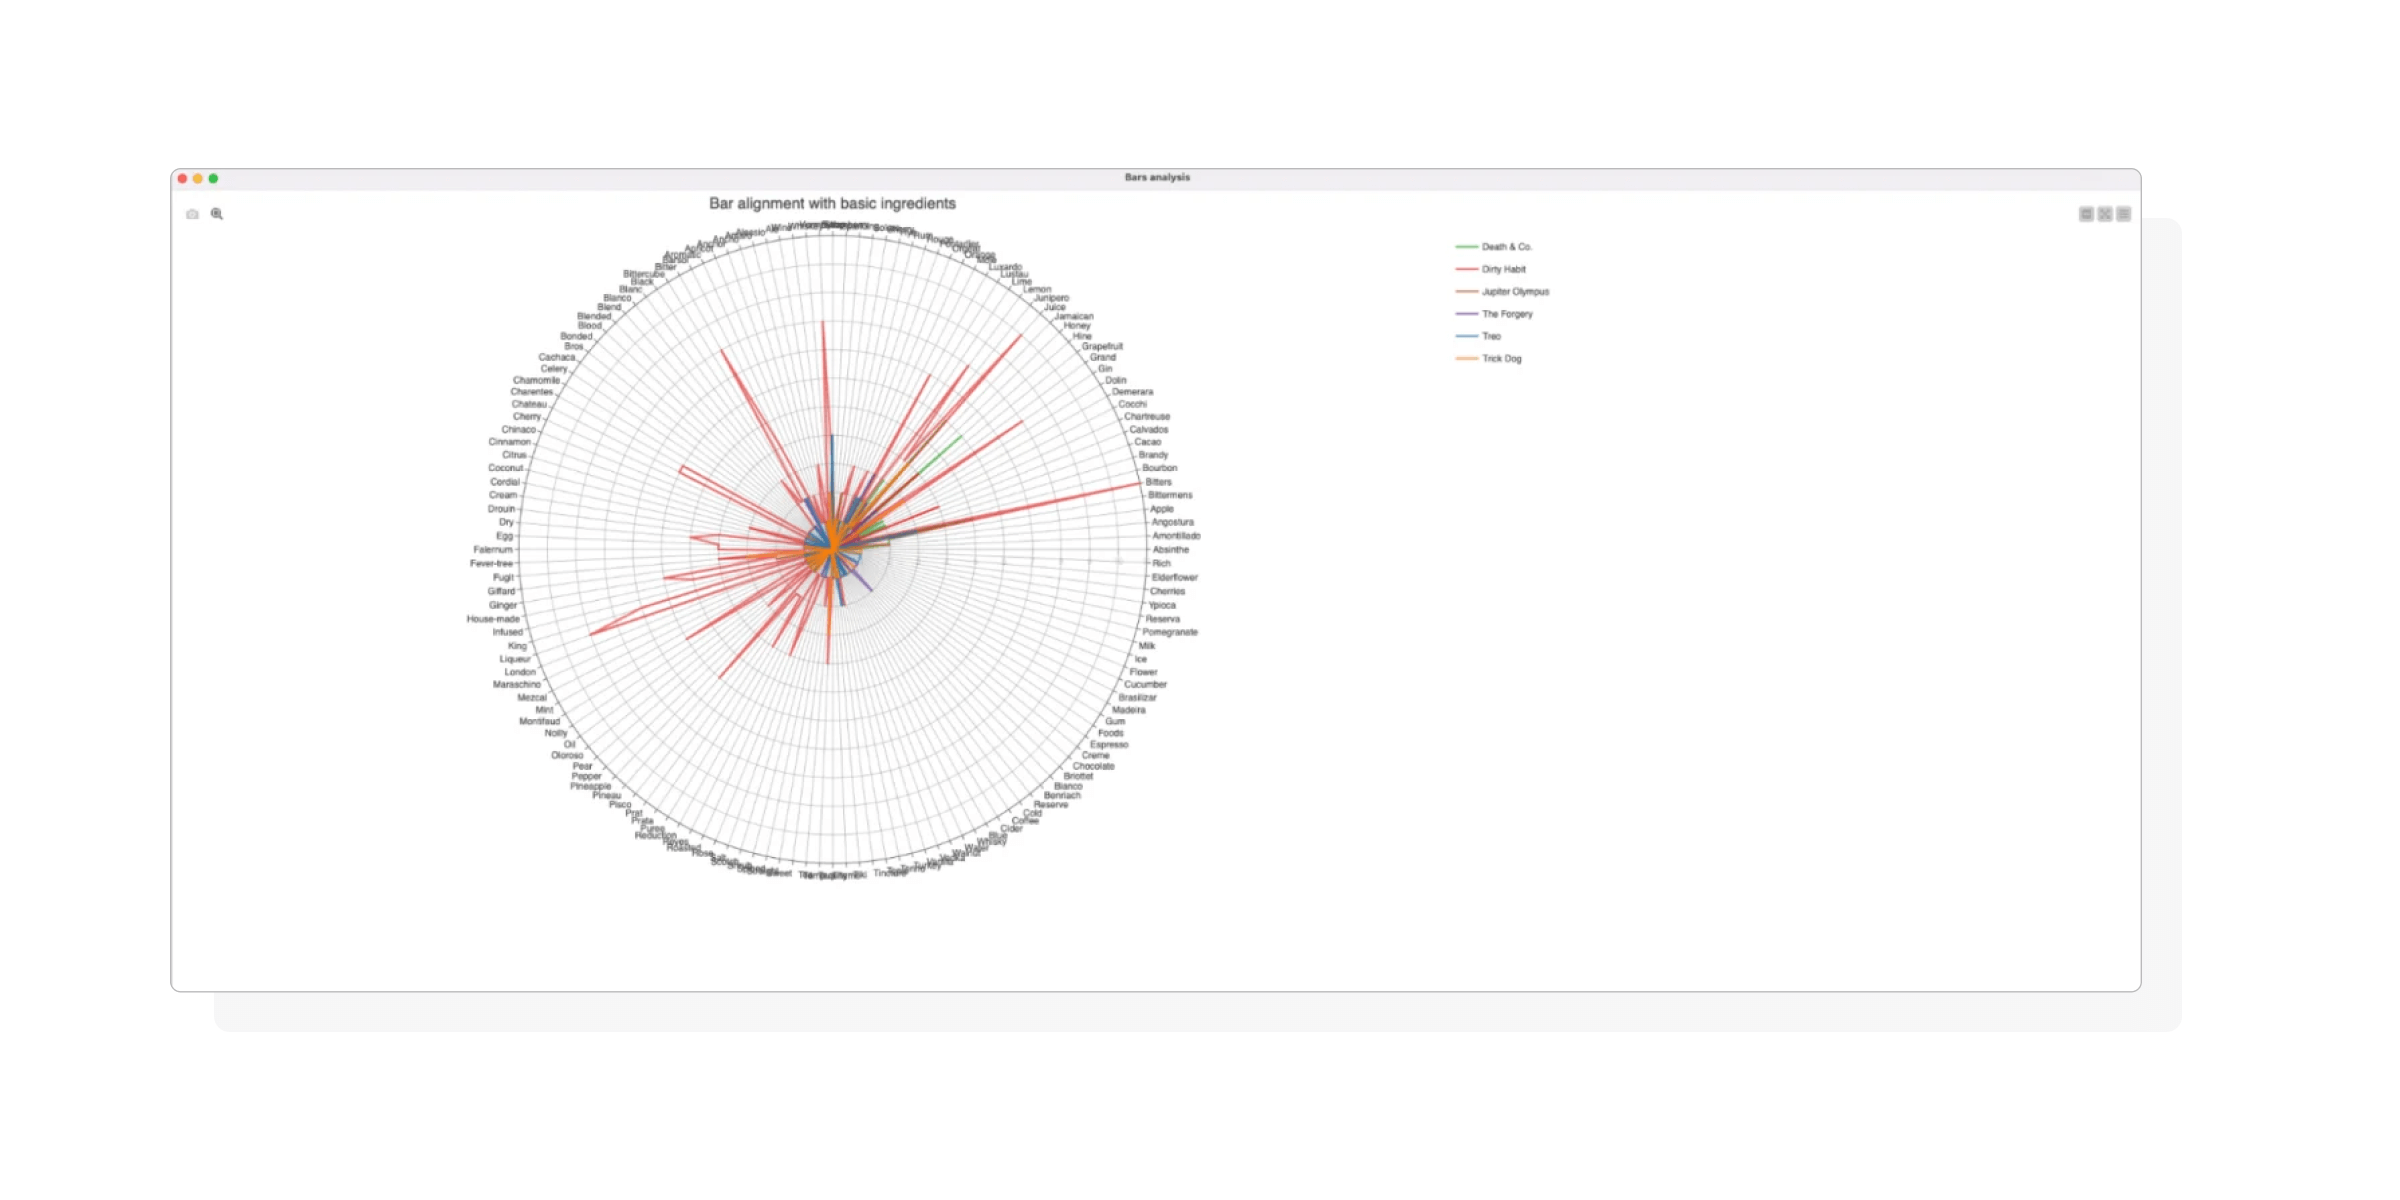 Radar plot of bars alignment to basic ingredients produced by Bars analysis component.
Specifically, we noted that five bars were underutilising ingredients in the bottom-right quadrant. This could help bars identify gaps and add new drinks to their menu.
Use Case 3: Understanding Glassware Patterns
For use case 3, we investigated glassware patterns. We explored the relationships between cocktails containing basic ingredients and their associated glassware. To visualize this, we used:
- A pie chart to show glassware frequency.
- A sunburst diagram to show ingredient ratios per glassware.
- A heatmap to illustrate ingredient-glassware usage
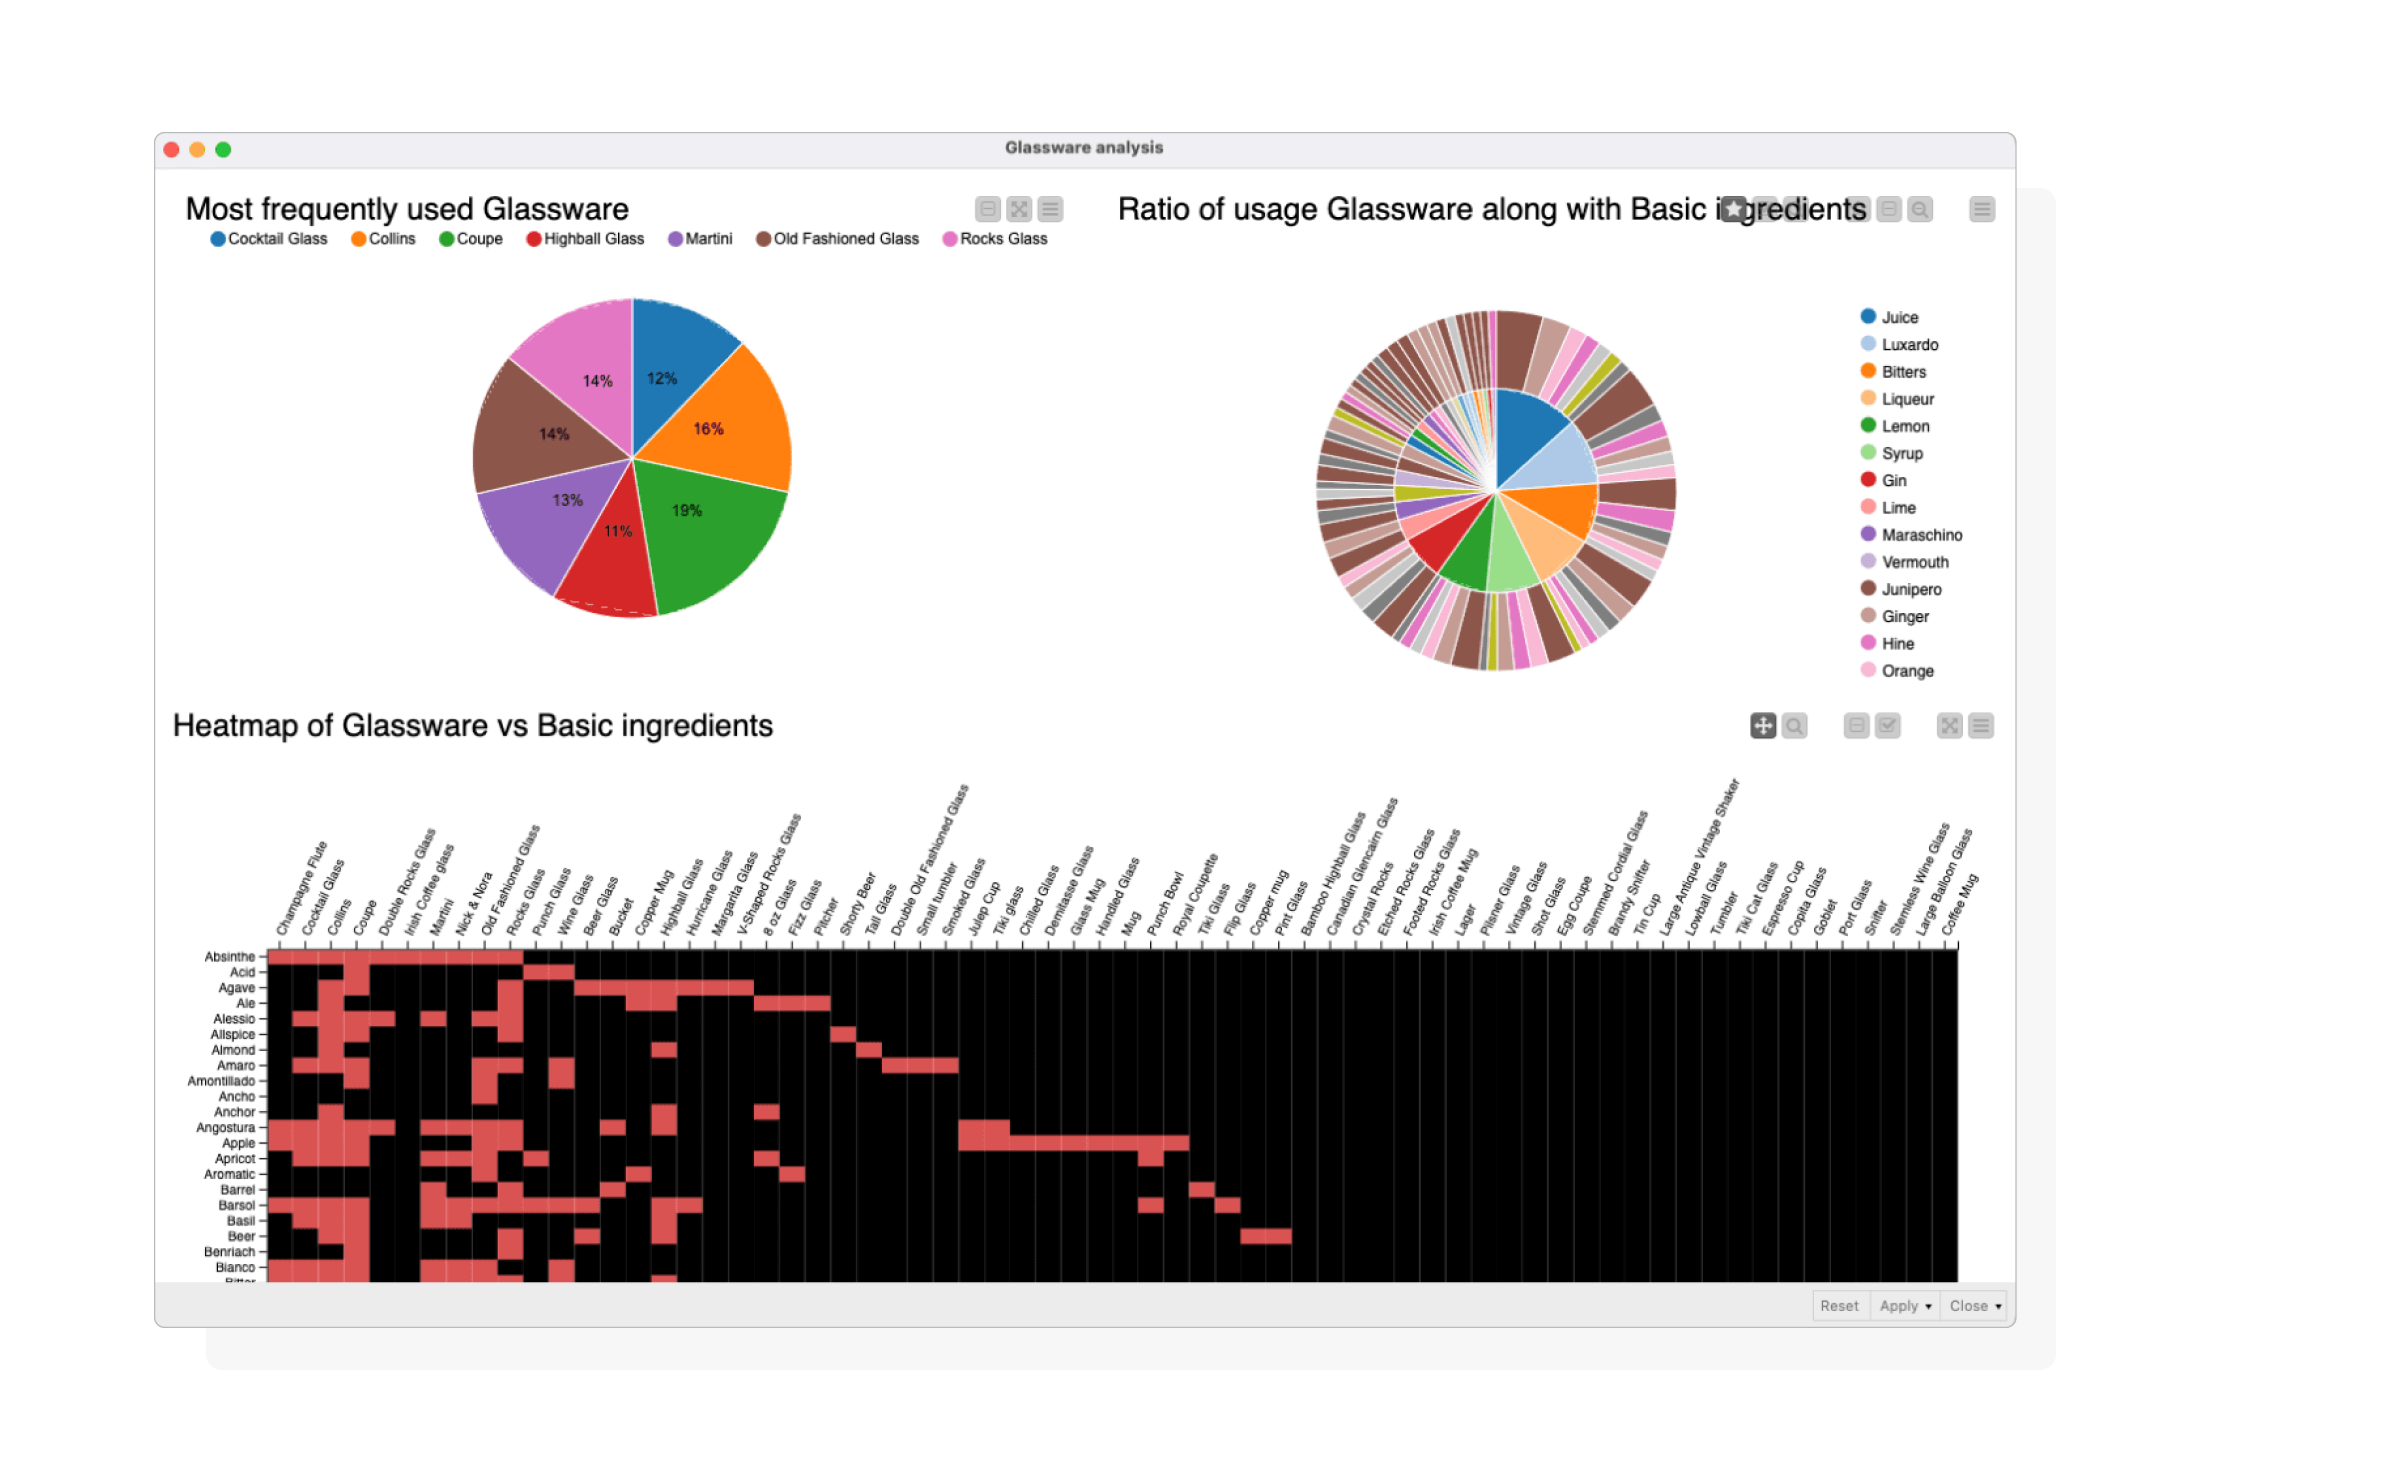 Dashboard showcasing glassware analysis
Use Case 4: Explore Bartender Connections
We employed graph traversal and pathfinding to uncover networking opportunities among bartenders, specifically examining connections based on shared workplaces.
- Our analysis focused on bartenders, Joaquin Simo and David Ruiz, seeking to identify their potential colleagues and shared bars.
- We grouped the resulting nodes and relationships into lists and then used an Ungroup node to process them.
- The Path Table visualization revealed that Joaquin Simo and David Ruiz share a mutual colleague who works at bars in both New York and San Francisco.
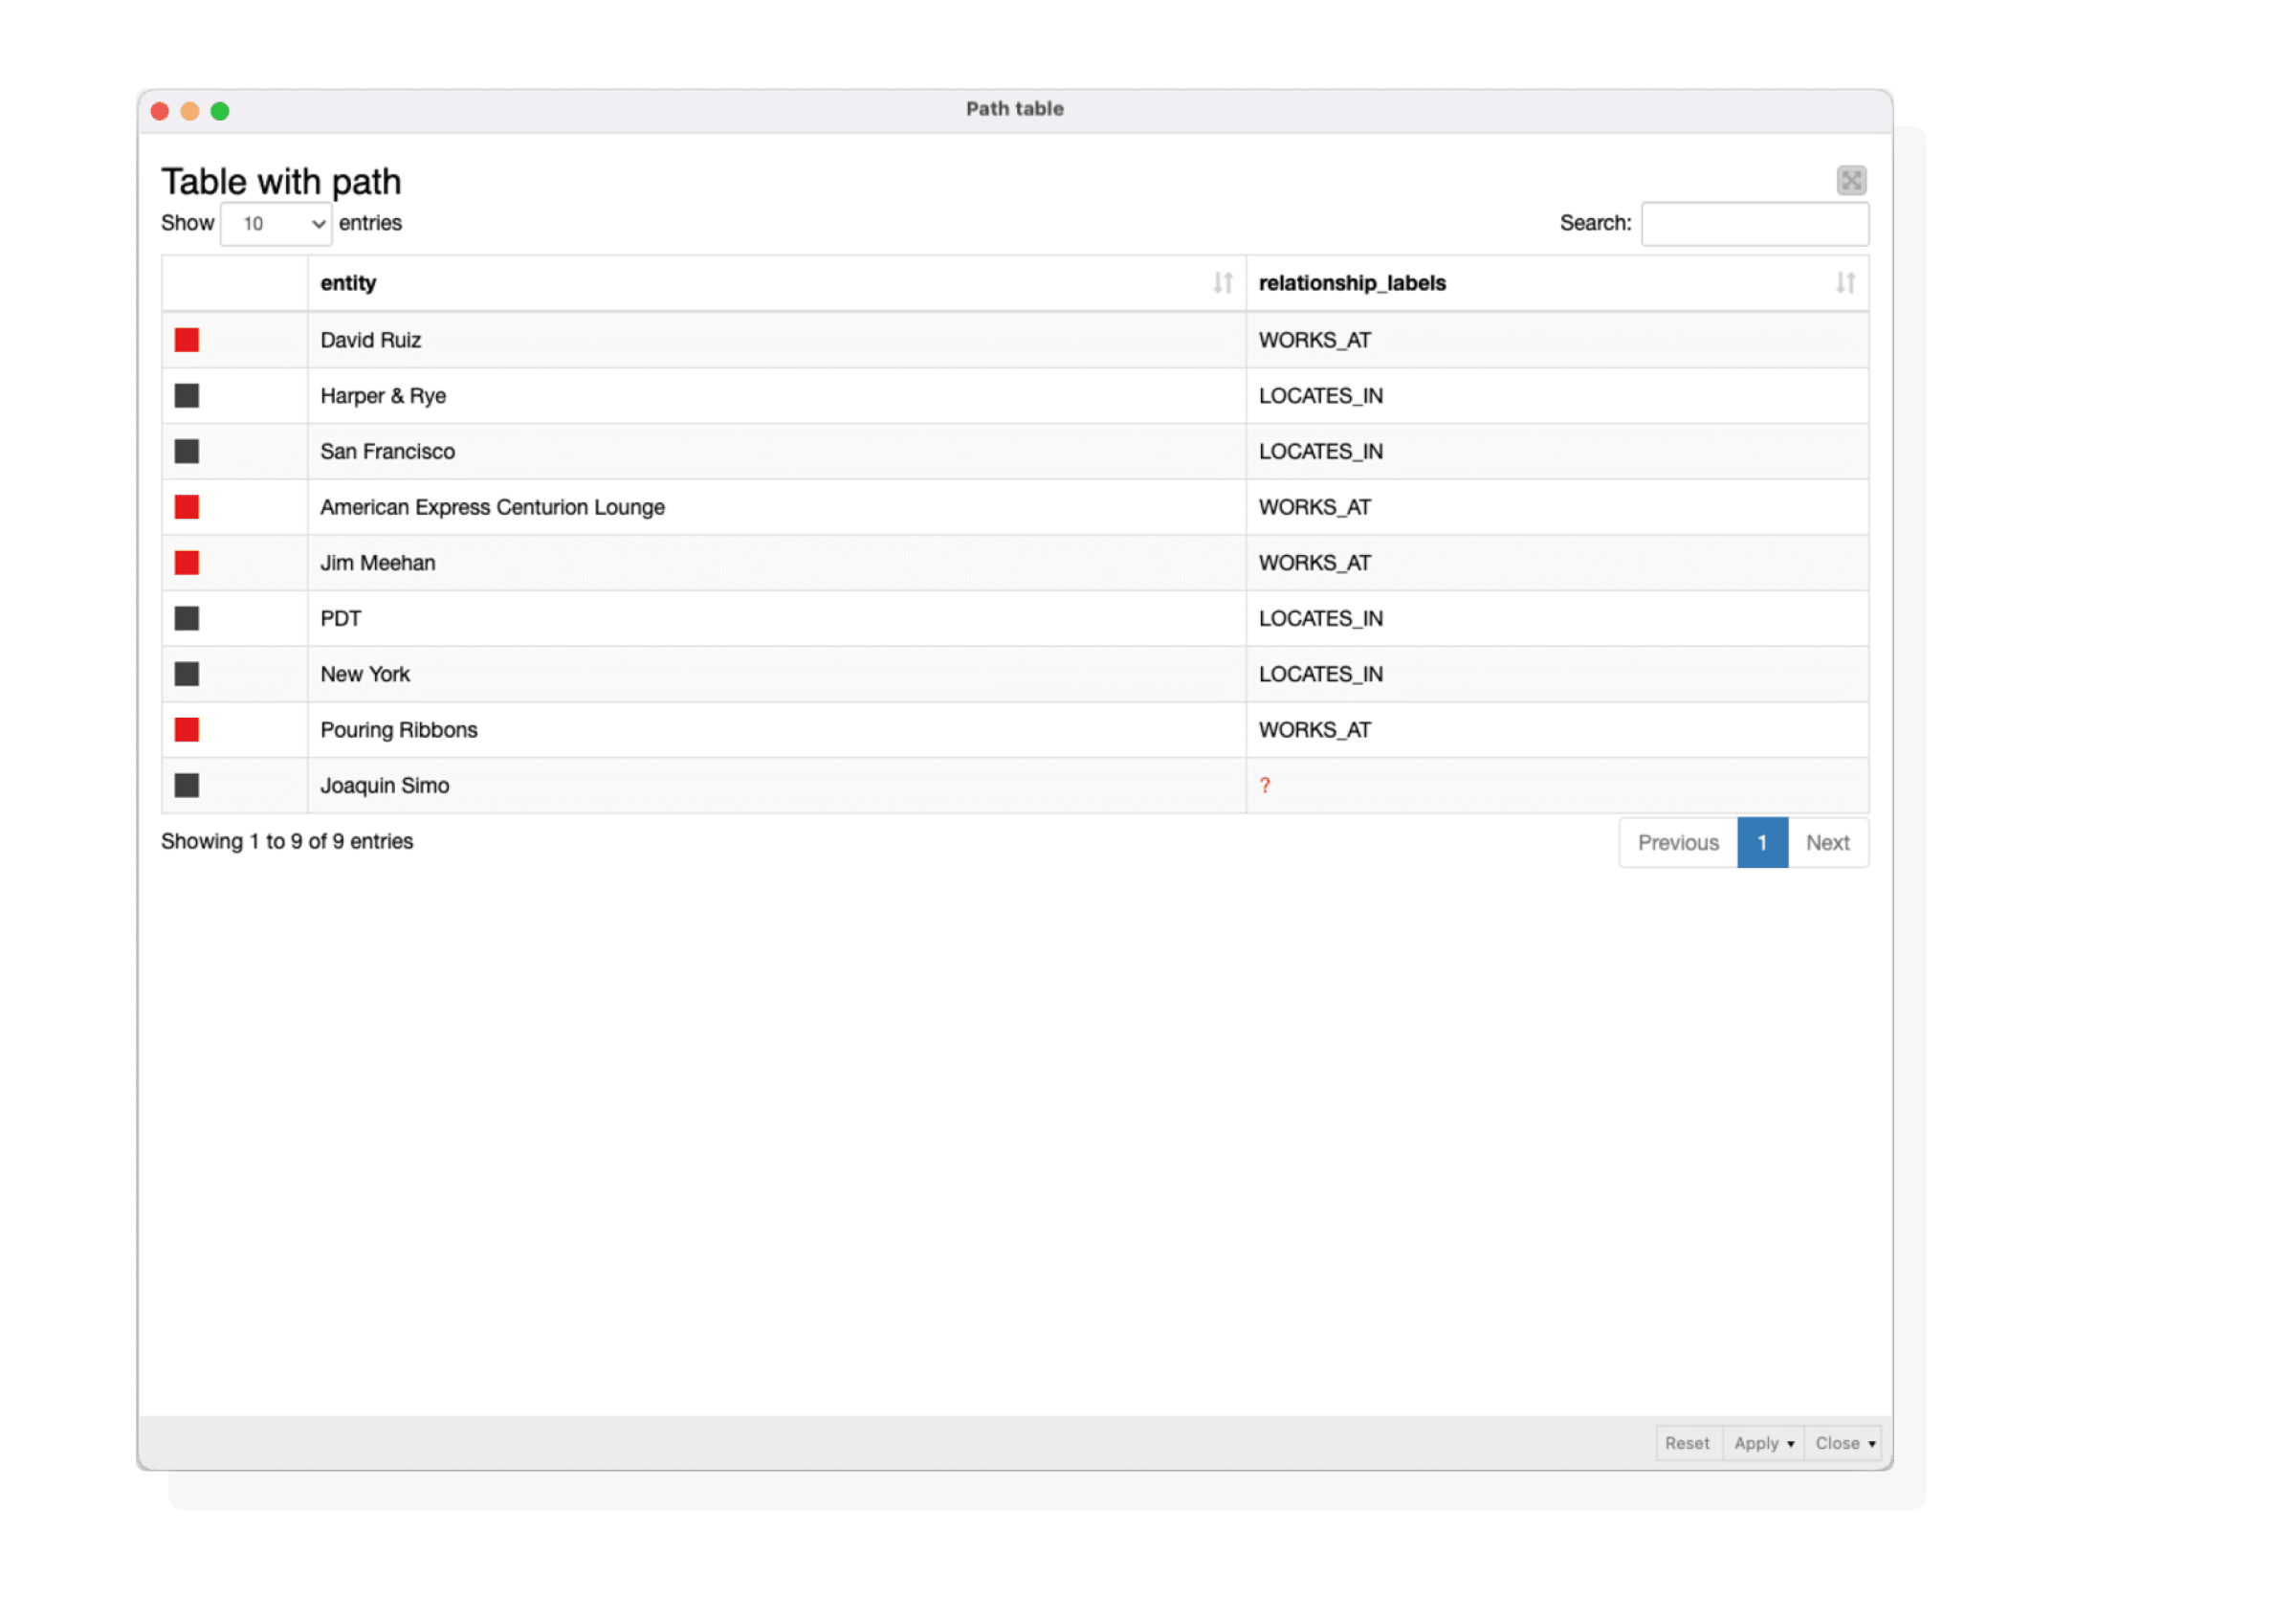 Table with path
Use Case 5: Recommend Missing Ingredients
To optimise bar inventory, we generated ingredient recommendations by querying the database for missing ingredients in cocktail recipes.
- Our query identifies missing ingredients needed to create specific cocktails.
- The output provides a table of cocktails and recommended missing ingredients (”soft” requirements).
- For precise inventory management, we can apply “strict” requirements, ensuring cocktails are made exclusively from available ingredients.
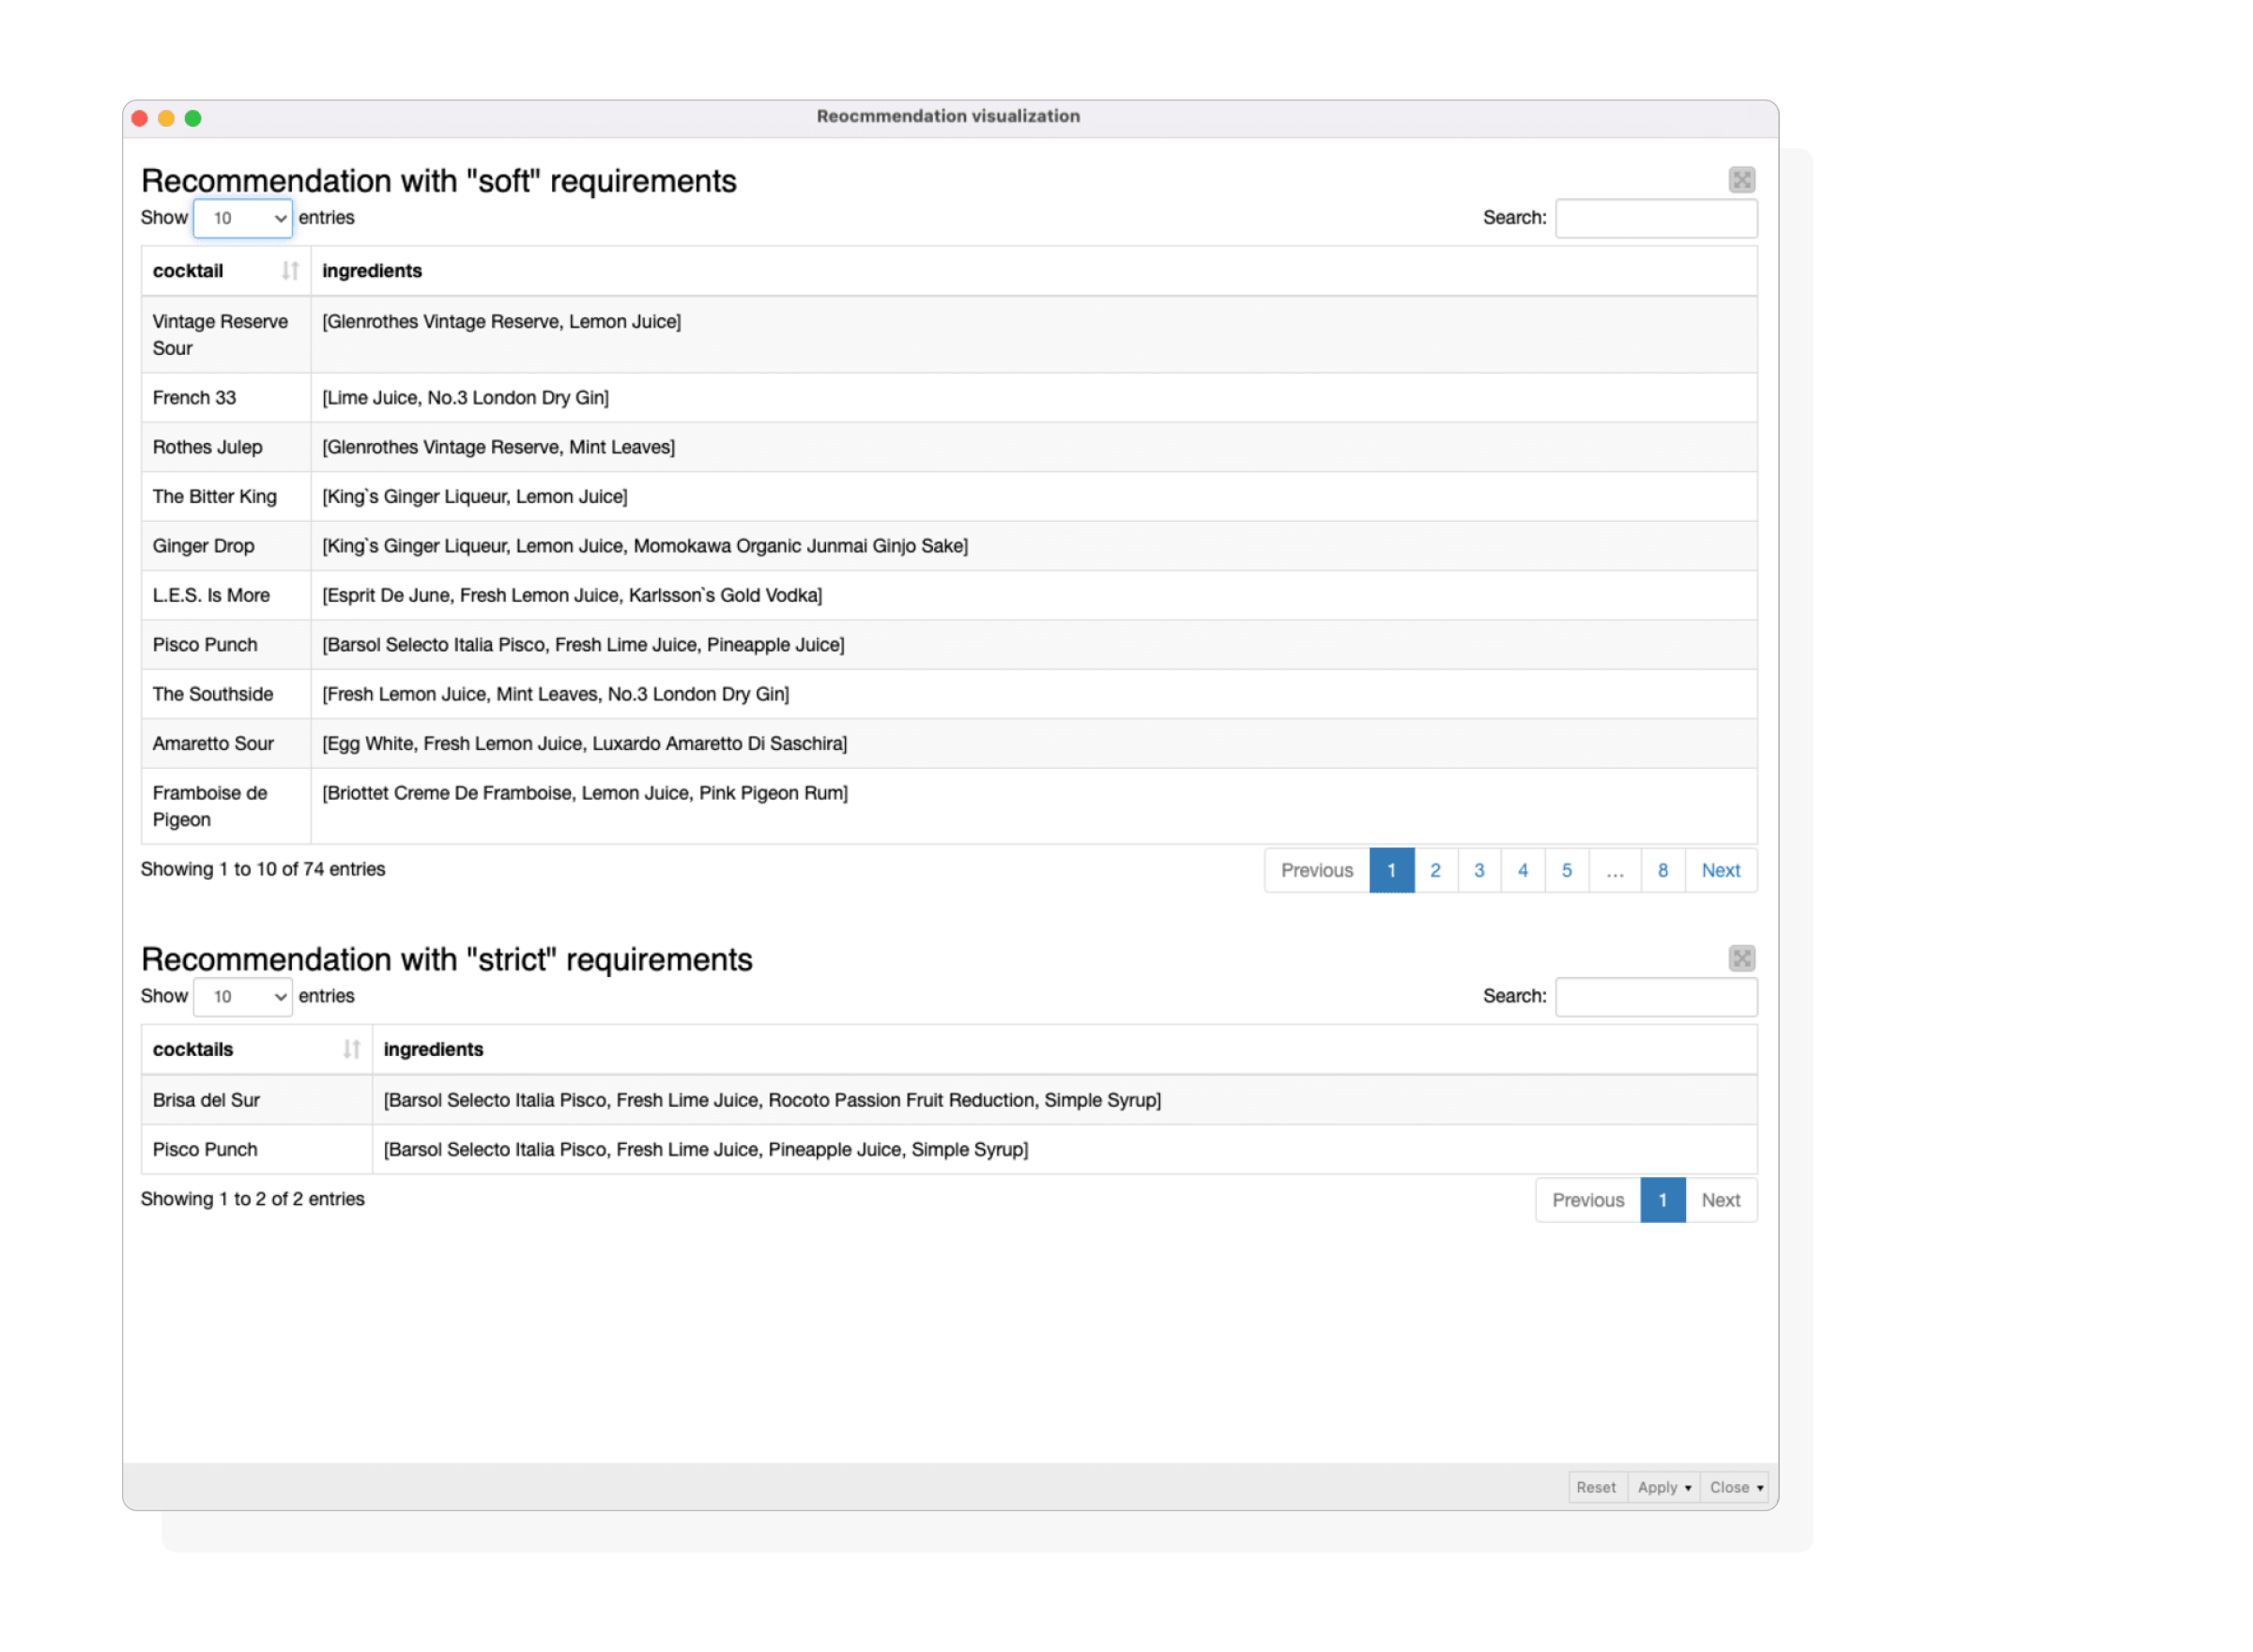 Recommendation visualisation with “soft” (upper) and strict (lower) requirements.
Use Case 6: Map Bartender Locations
To reveal potential networking opportunities, we visualized bartenders working across multiple bar locations using our bartender network component.
- We began by identifying bartenders employed at more than one bar.
- Next, we generated location queries using the String Manipulation node.
- The workflow efficiently executed multiple reading queries concurrently, returning results as JSON files.
- These JSON files were then parsed by the JSON Path node within the Visualize bartender network component, displaying bartenders and their respective locations.
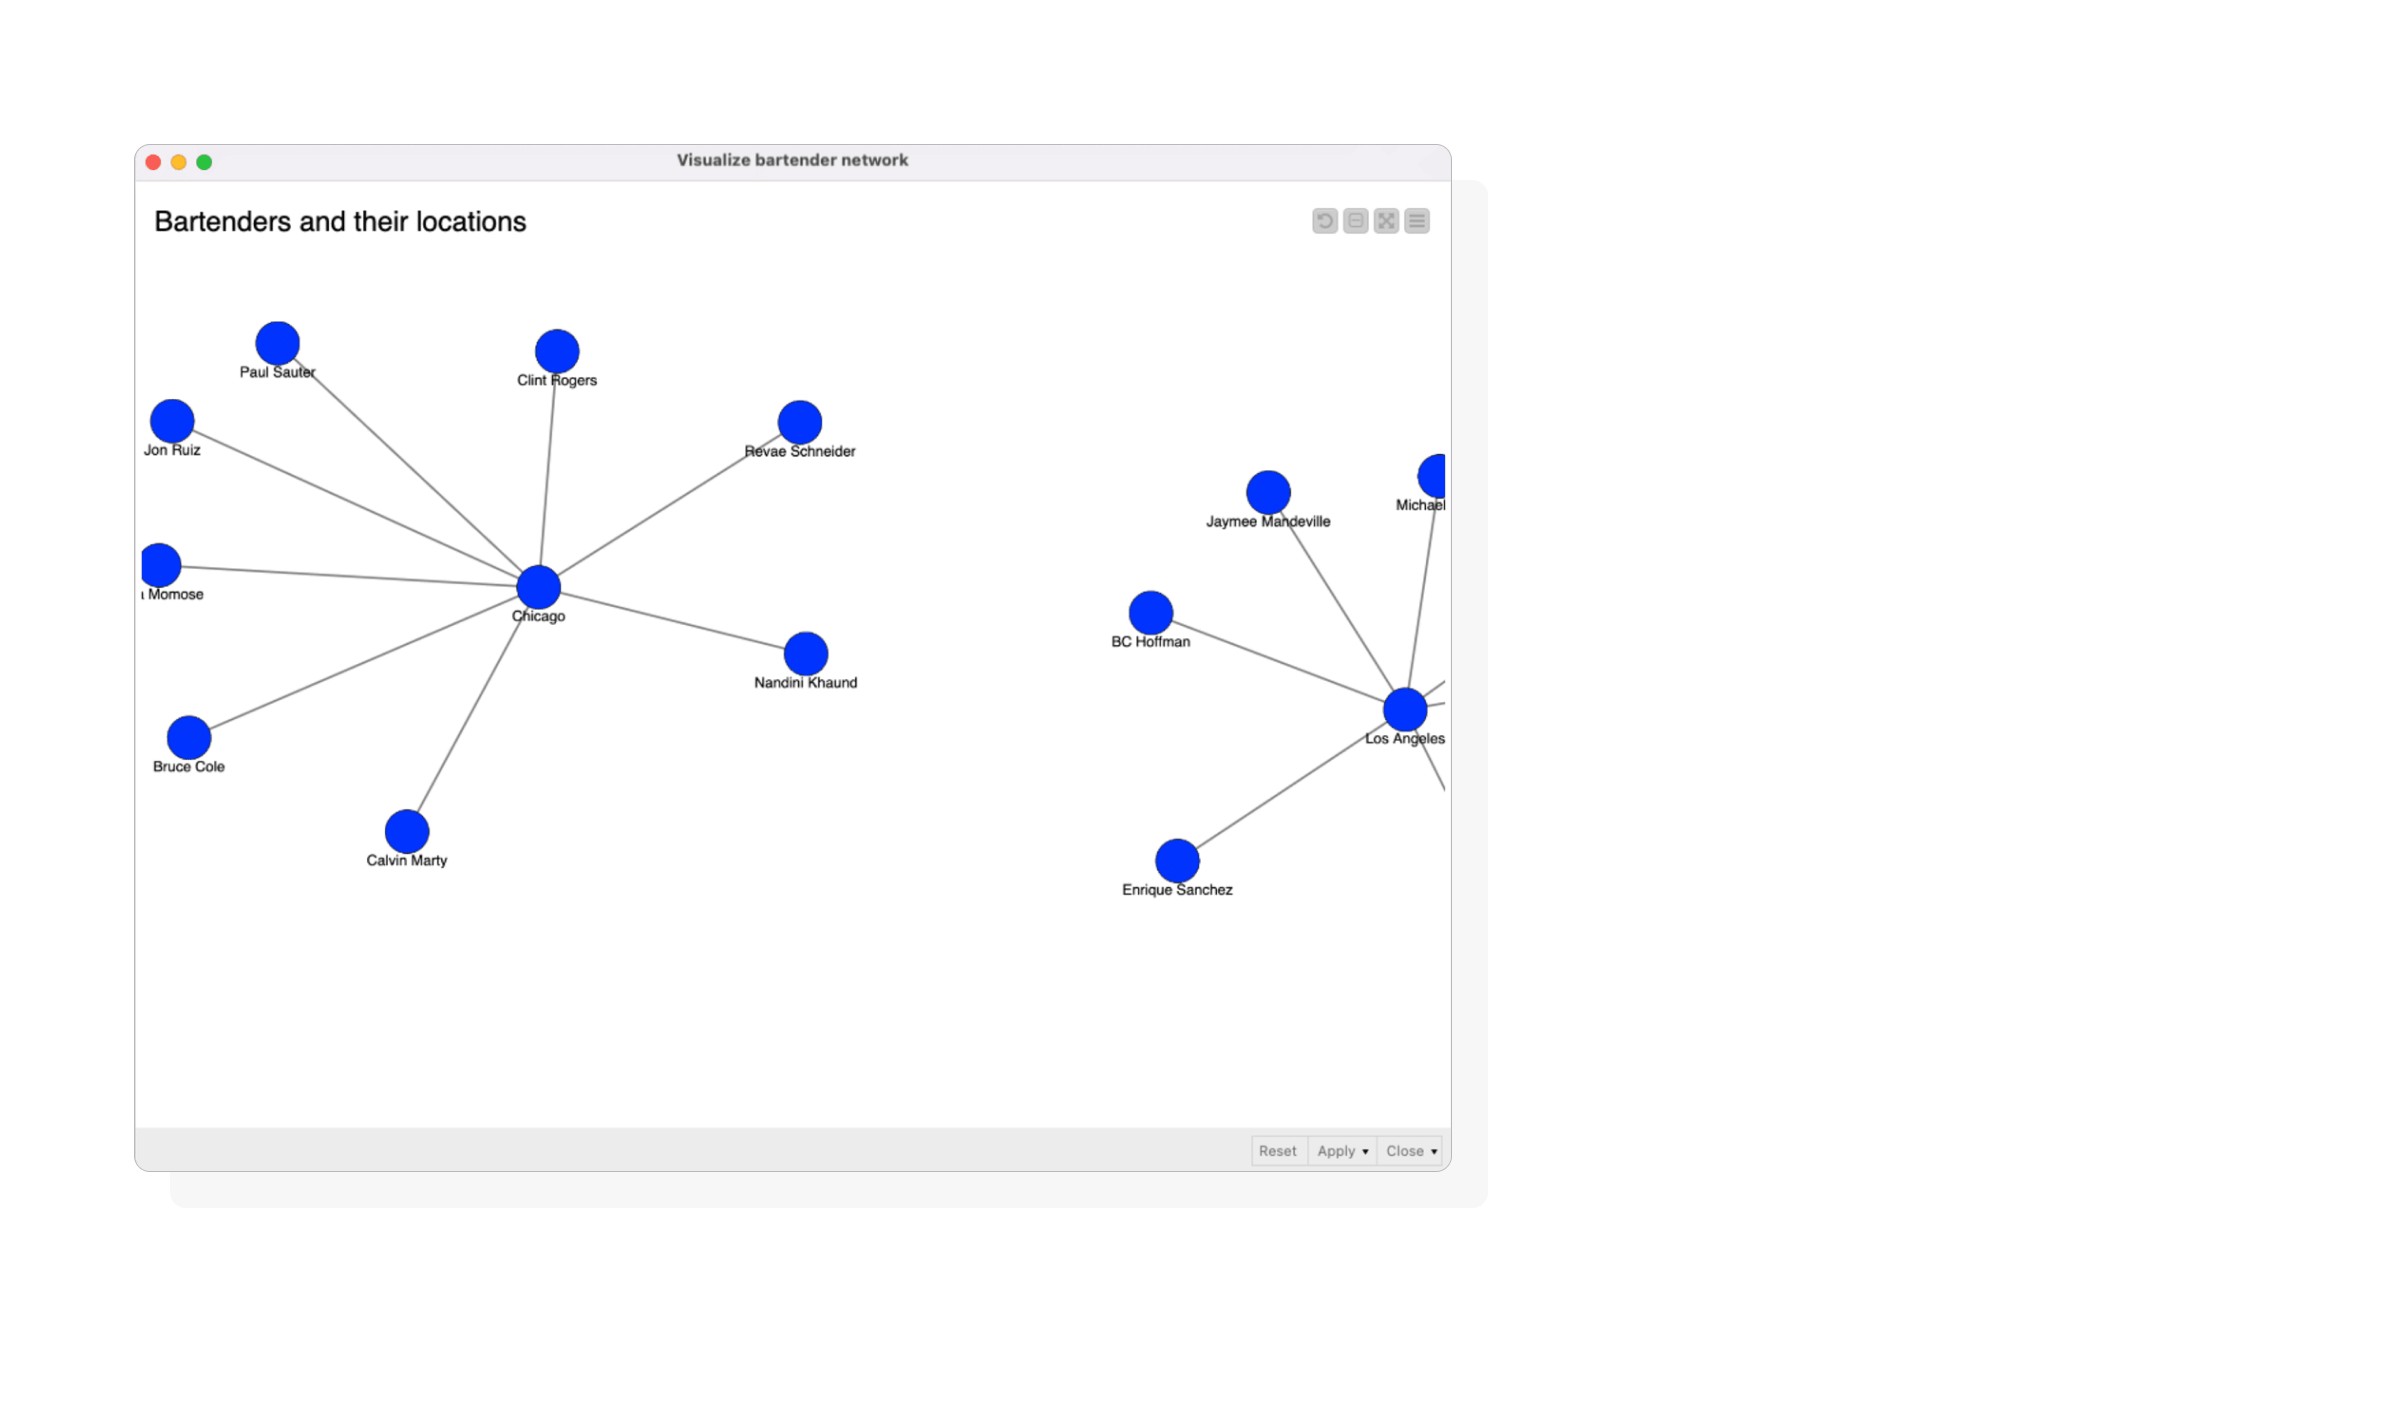 Sub-graph of bartender network and location..
Why Use Memgraph with KNIME?
Here’s why the Memgraph Extension for KNIME is useful:
- Low-Code Integration: No need to write complex scripts. You can simply drag, drop, and configure your queries visually.
- Real-Time Graph Analytics: Memgraph is optimised for fast graph traversals, pattern matching, and dynamic graph processing.
- Data Science and AI-Ready: Combine Memgraph’s graph querying with KNIME’s advanced ML and analytics tools in a single pipeline.
Whether you're doing network analysis, building recommendation engines, or exploring connected data, Memgraph extension for KNIME gives you the tools to build powerful graph workflows visually.
Ready to Get Started?
Download KNIME and use Memgraph Extension (built by our partners at Redfield) to start working with connected data right away. Combine Memgraph's speed with KNIME's visual workflows and see what insights you can discover in your data.
This extension was developed in partnership with Redfield, a partner of KNIME and Memgraph.