
G.V() + Memgraph: Query, Visualize, Explore
Memgraph users, get ready for a new tool to add to your kit! G.V(), a dedicated client for graph databases, now supports Memgraph. This integration provides a focused set of capabilities to help you write, debug, test and analyze your Memgraph data more effectively.
G.V() is designed to complement your Memgraph database by offering practical developer tools, interactive data exploration features, and detailed graph visualization. Let's have a look at what you can do with G.V() and your Memgraph database.
How to Connect to G.V() to Memgraph
Connecting G.V() to your Memgraph database is a quick and easy process.
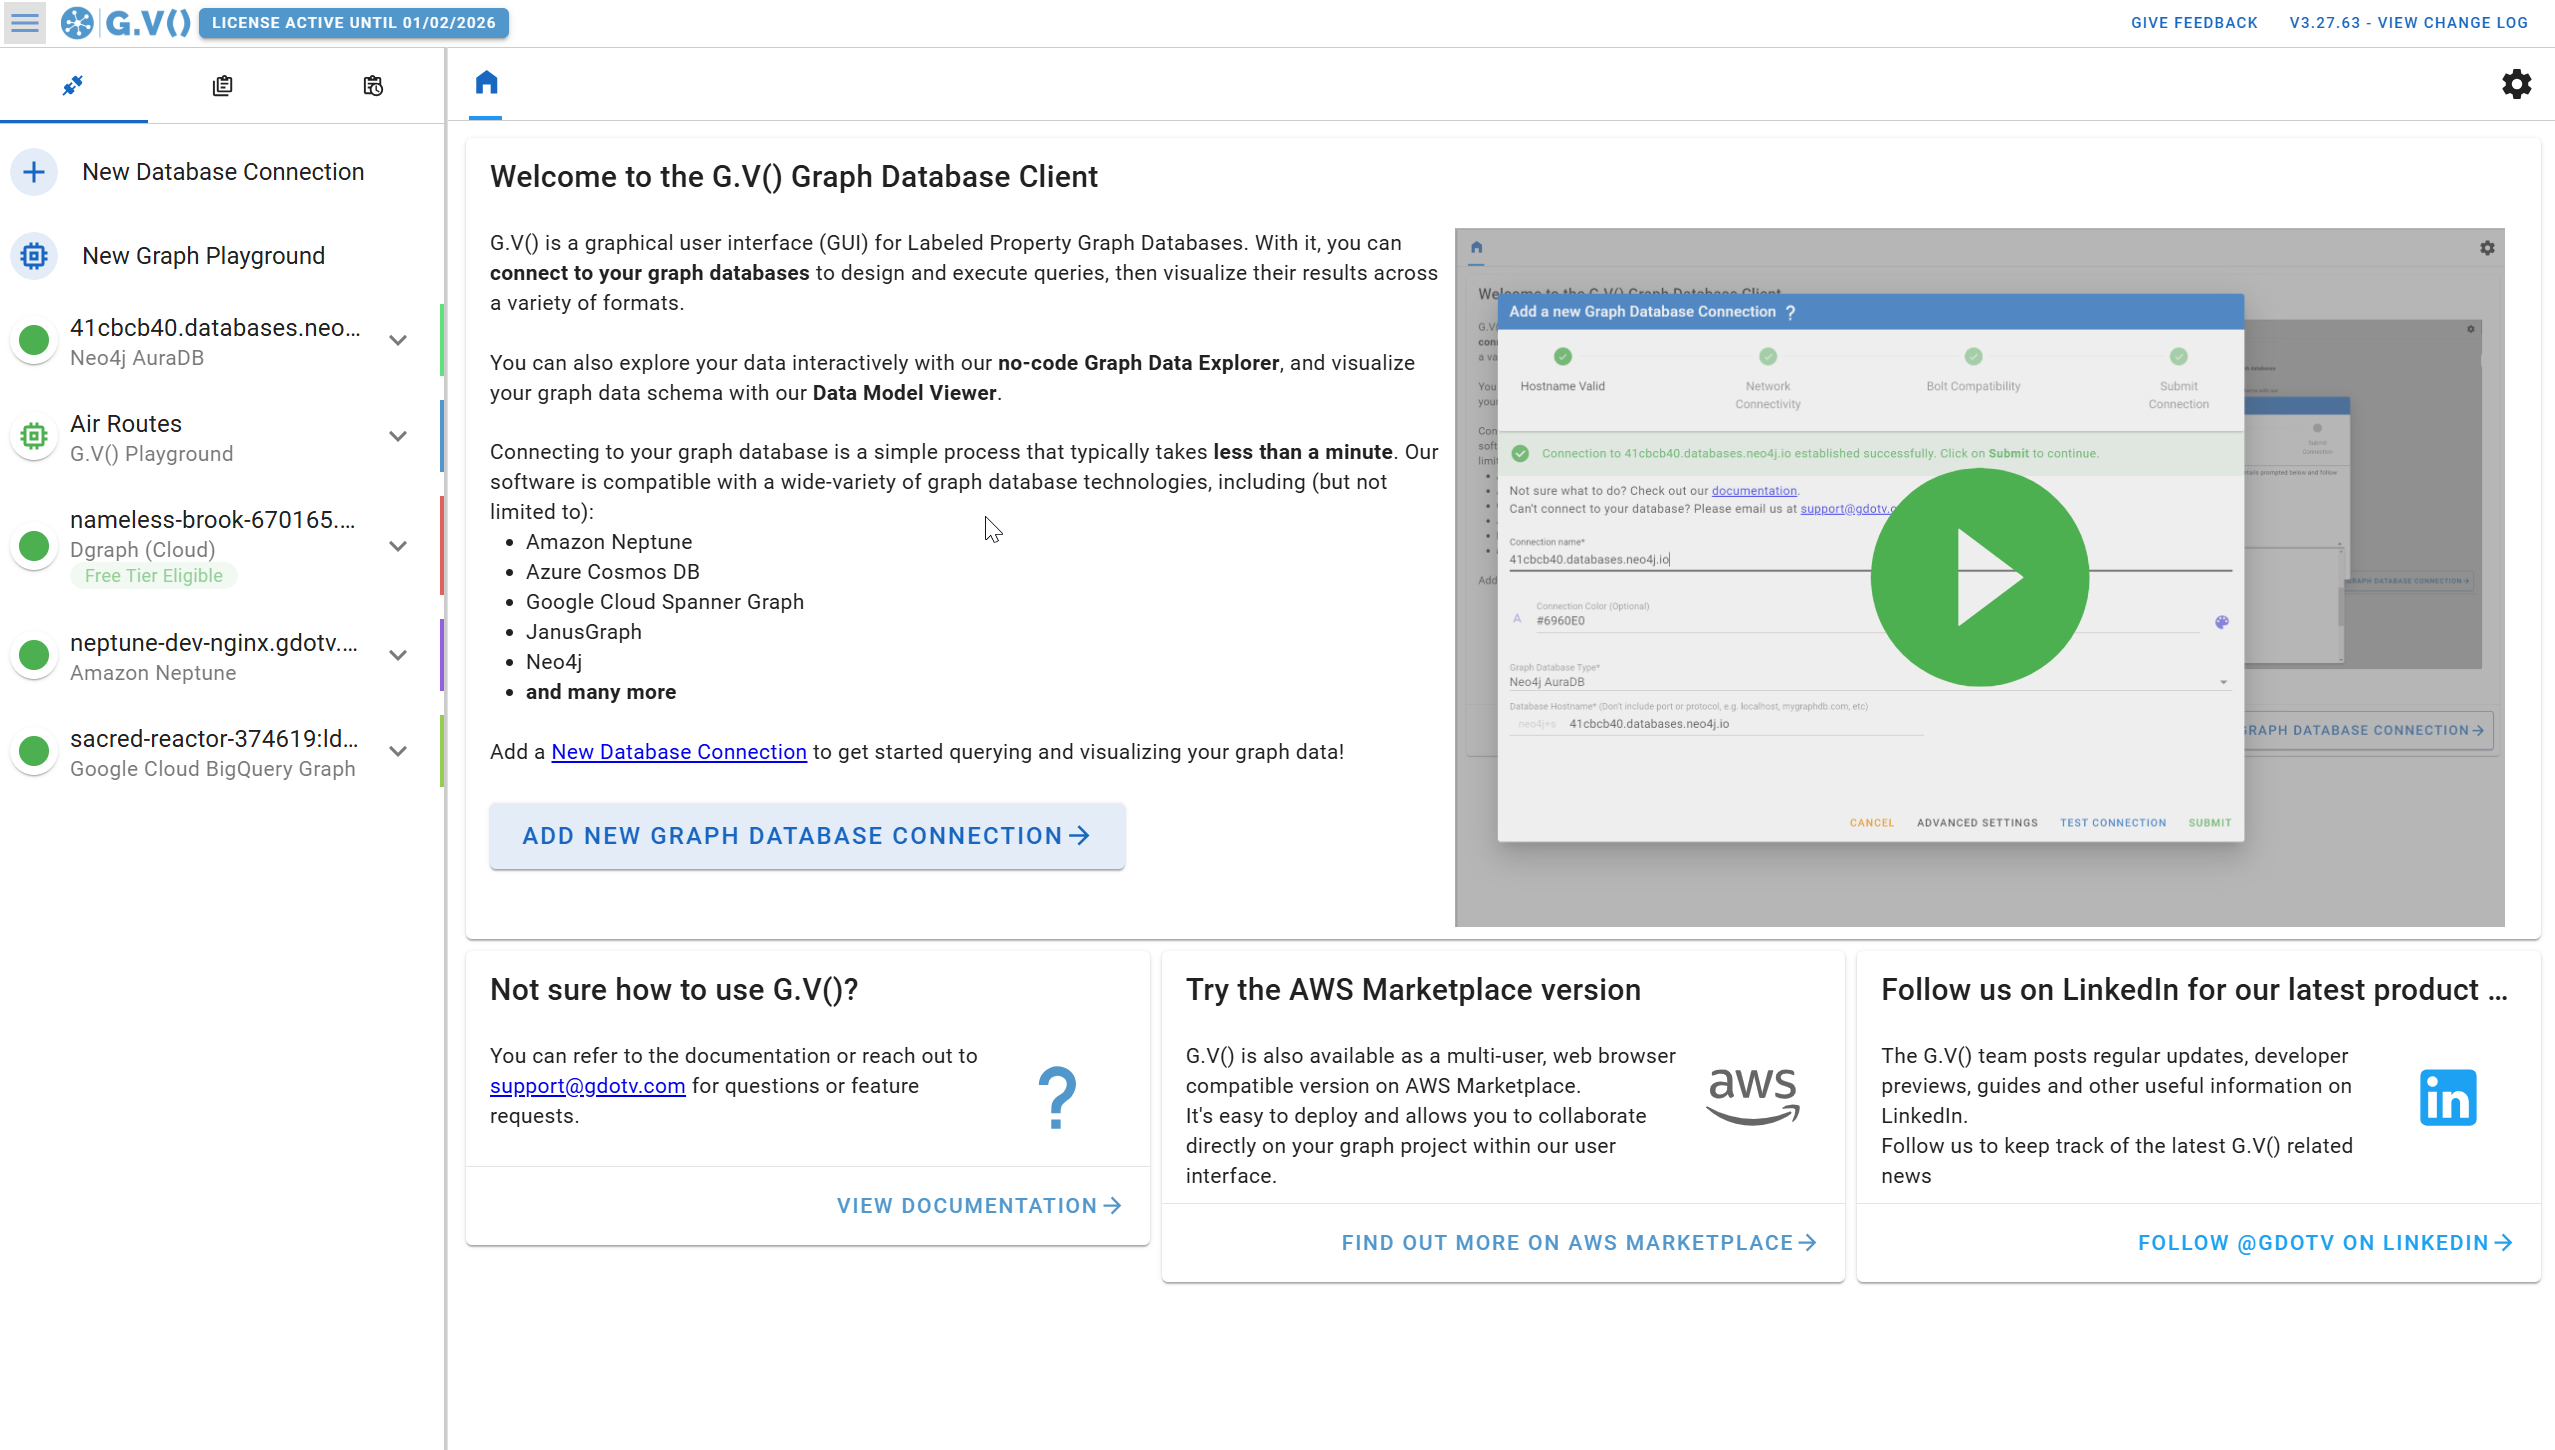
Choose "Memgraph" from the dropdown menu, enter your hostname, and provide any necessary credentials based on your setup. That's all there is to it.
What’s Does G.V() Offer?
Here are some key feature offered by G.V():
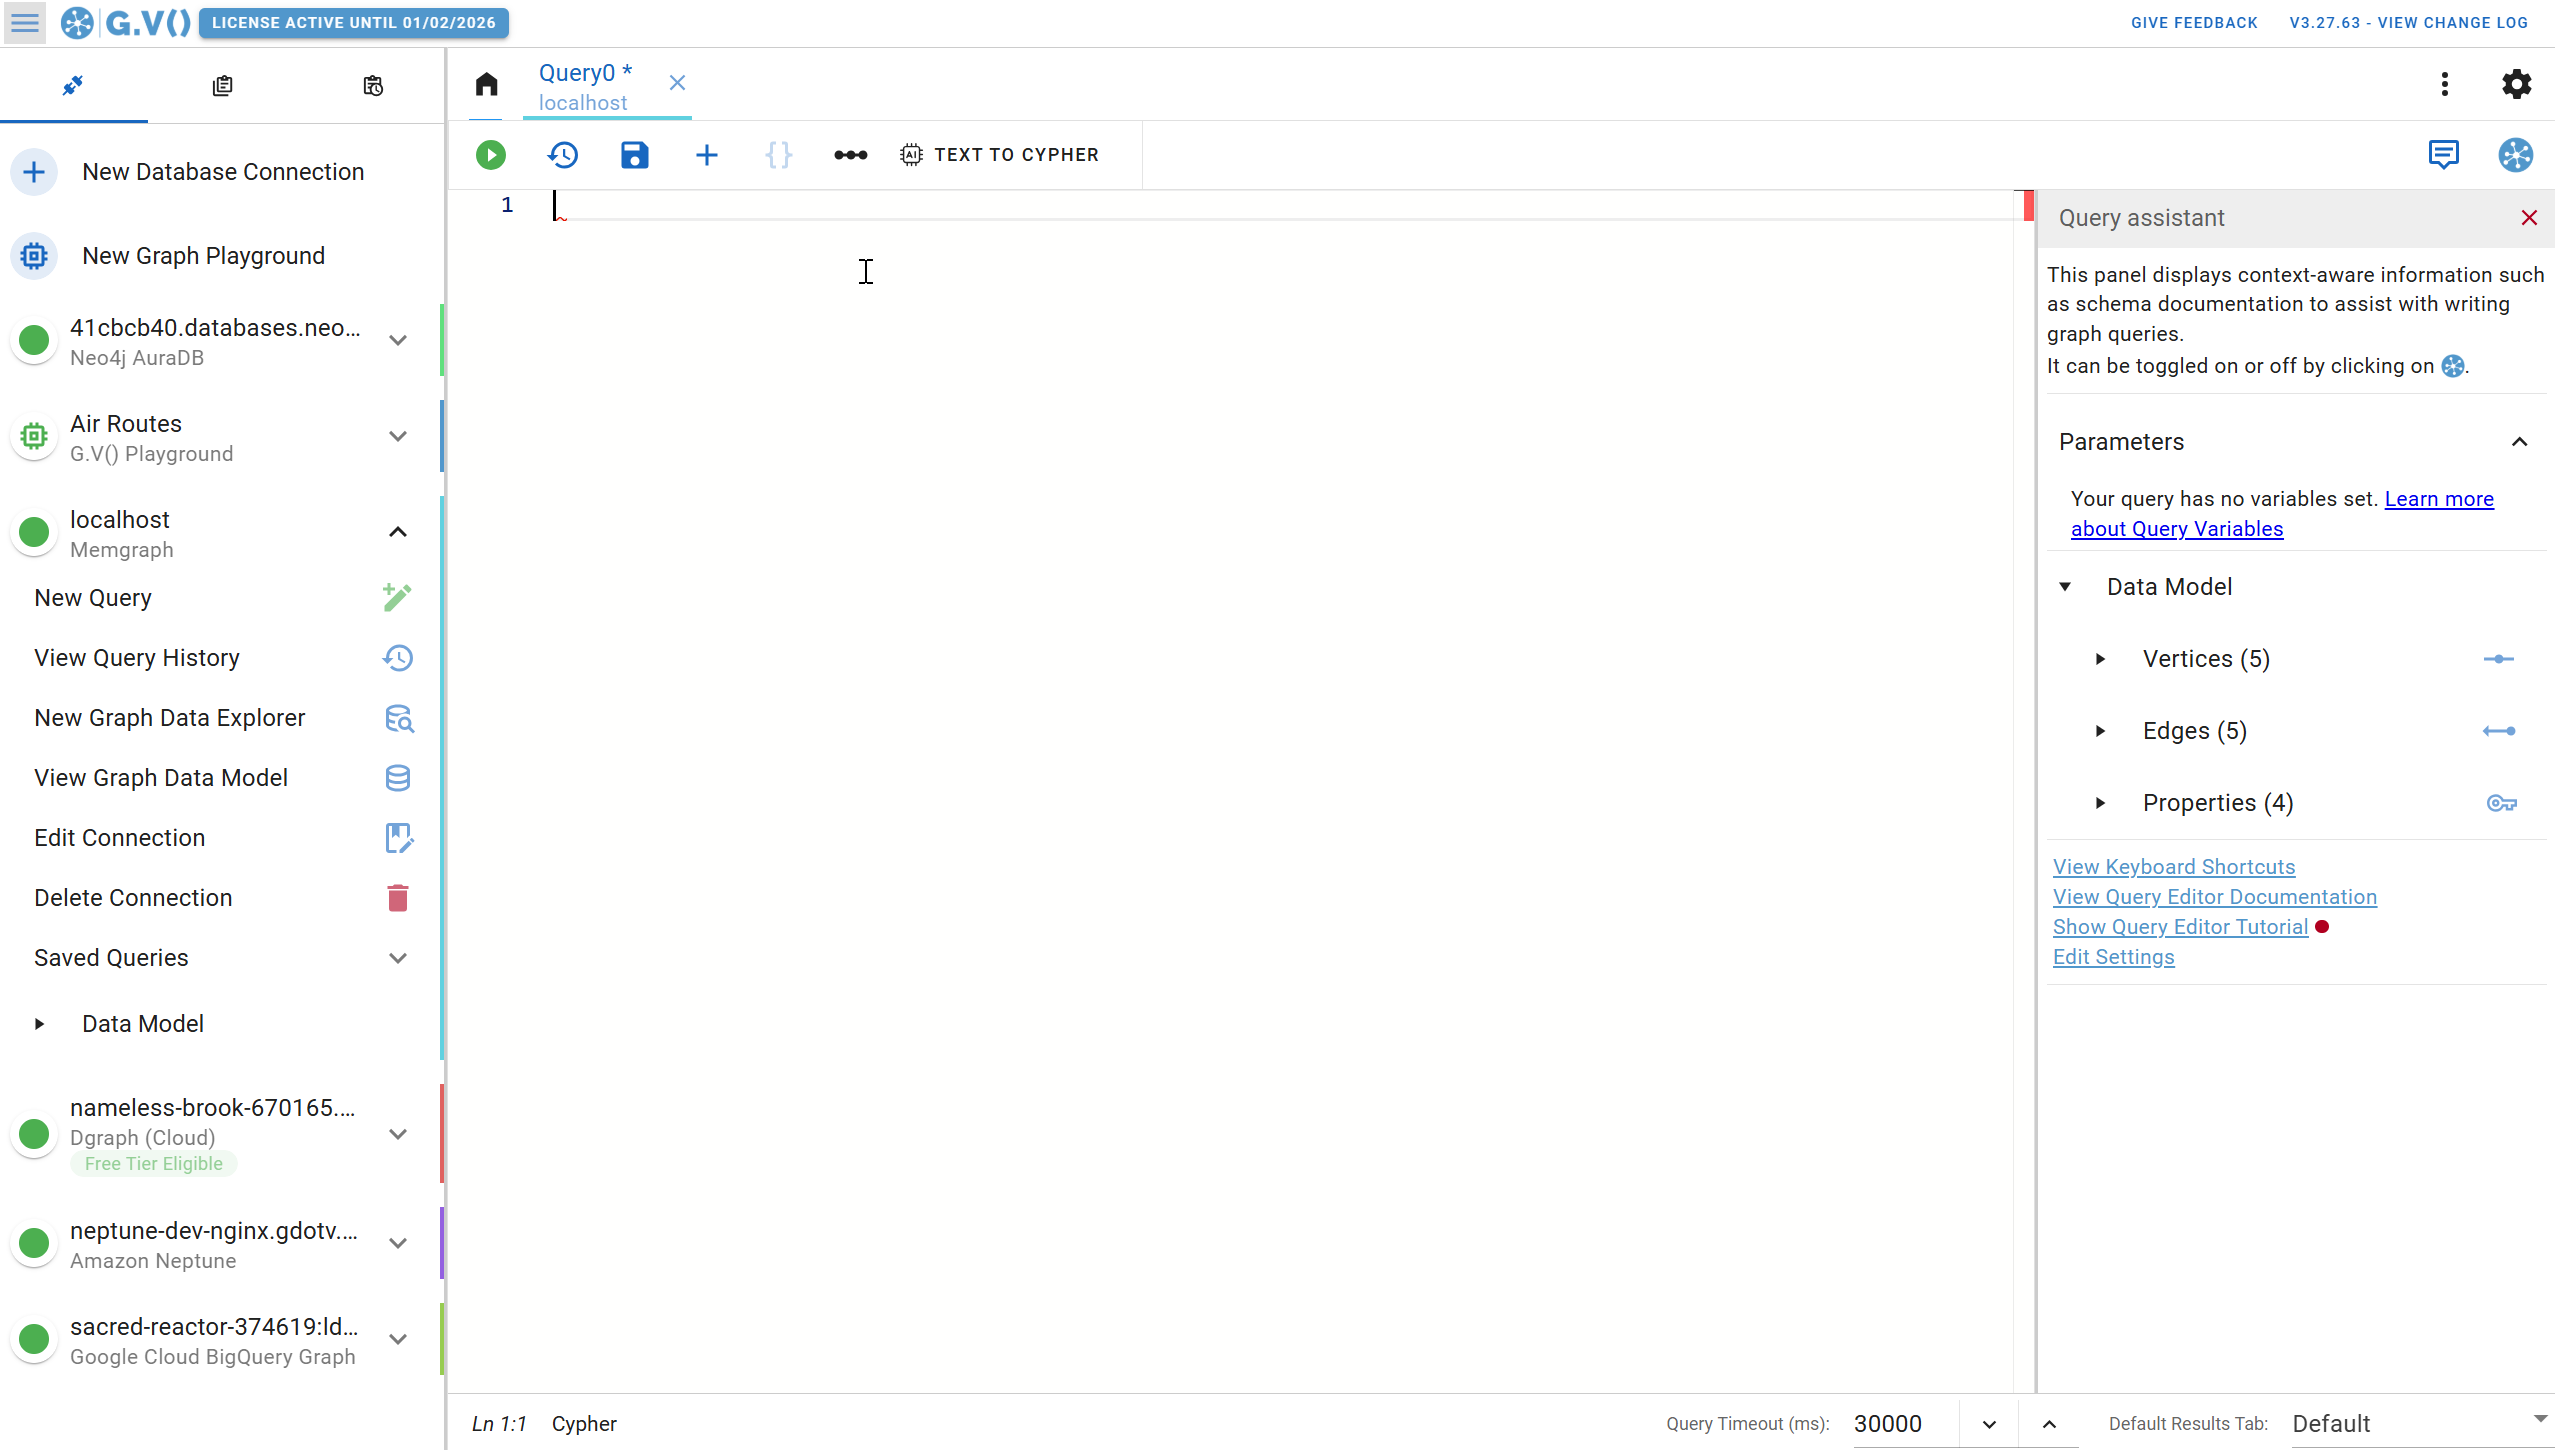
Run Cypher Queries Directly in G.V()
Once connected, you can immediately begin writing and executing Cypher queries. G.V() provides smart features like autocomplete and syntax validation, all tailored for Cypher syntax.
Plus, you can now save and organize Cypher queries using G.V()’s query collections. This especially saves up time for teams who frequently reuse standard queries.
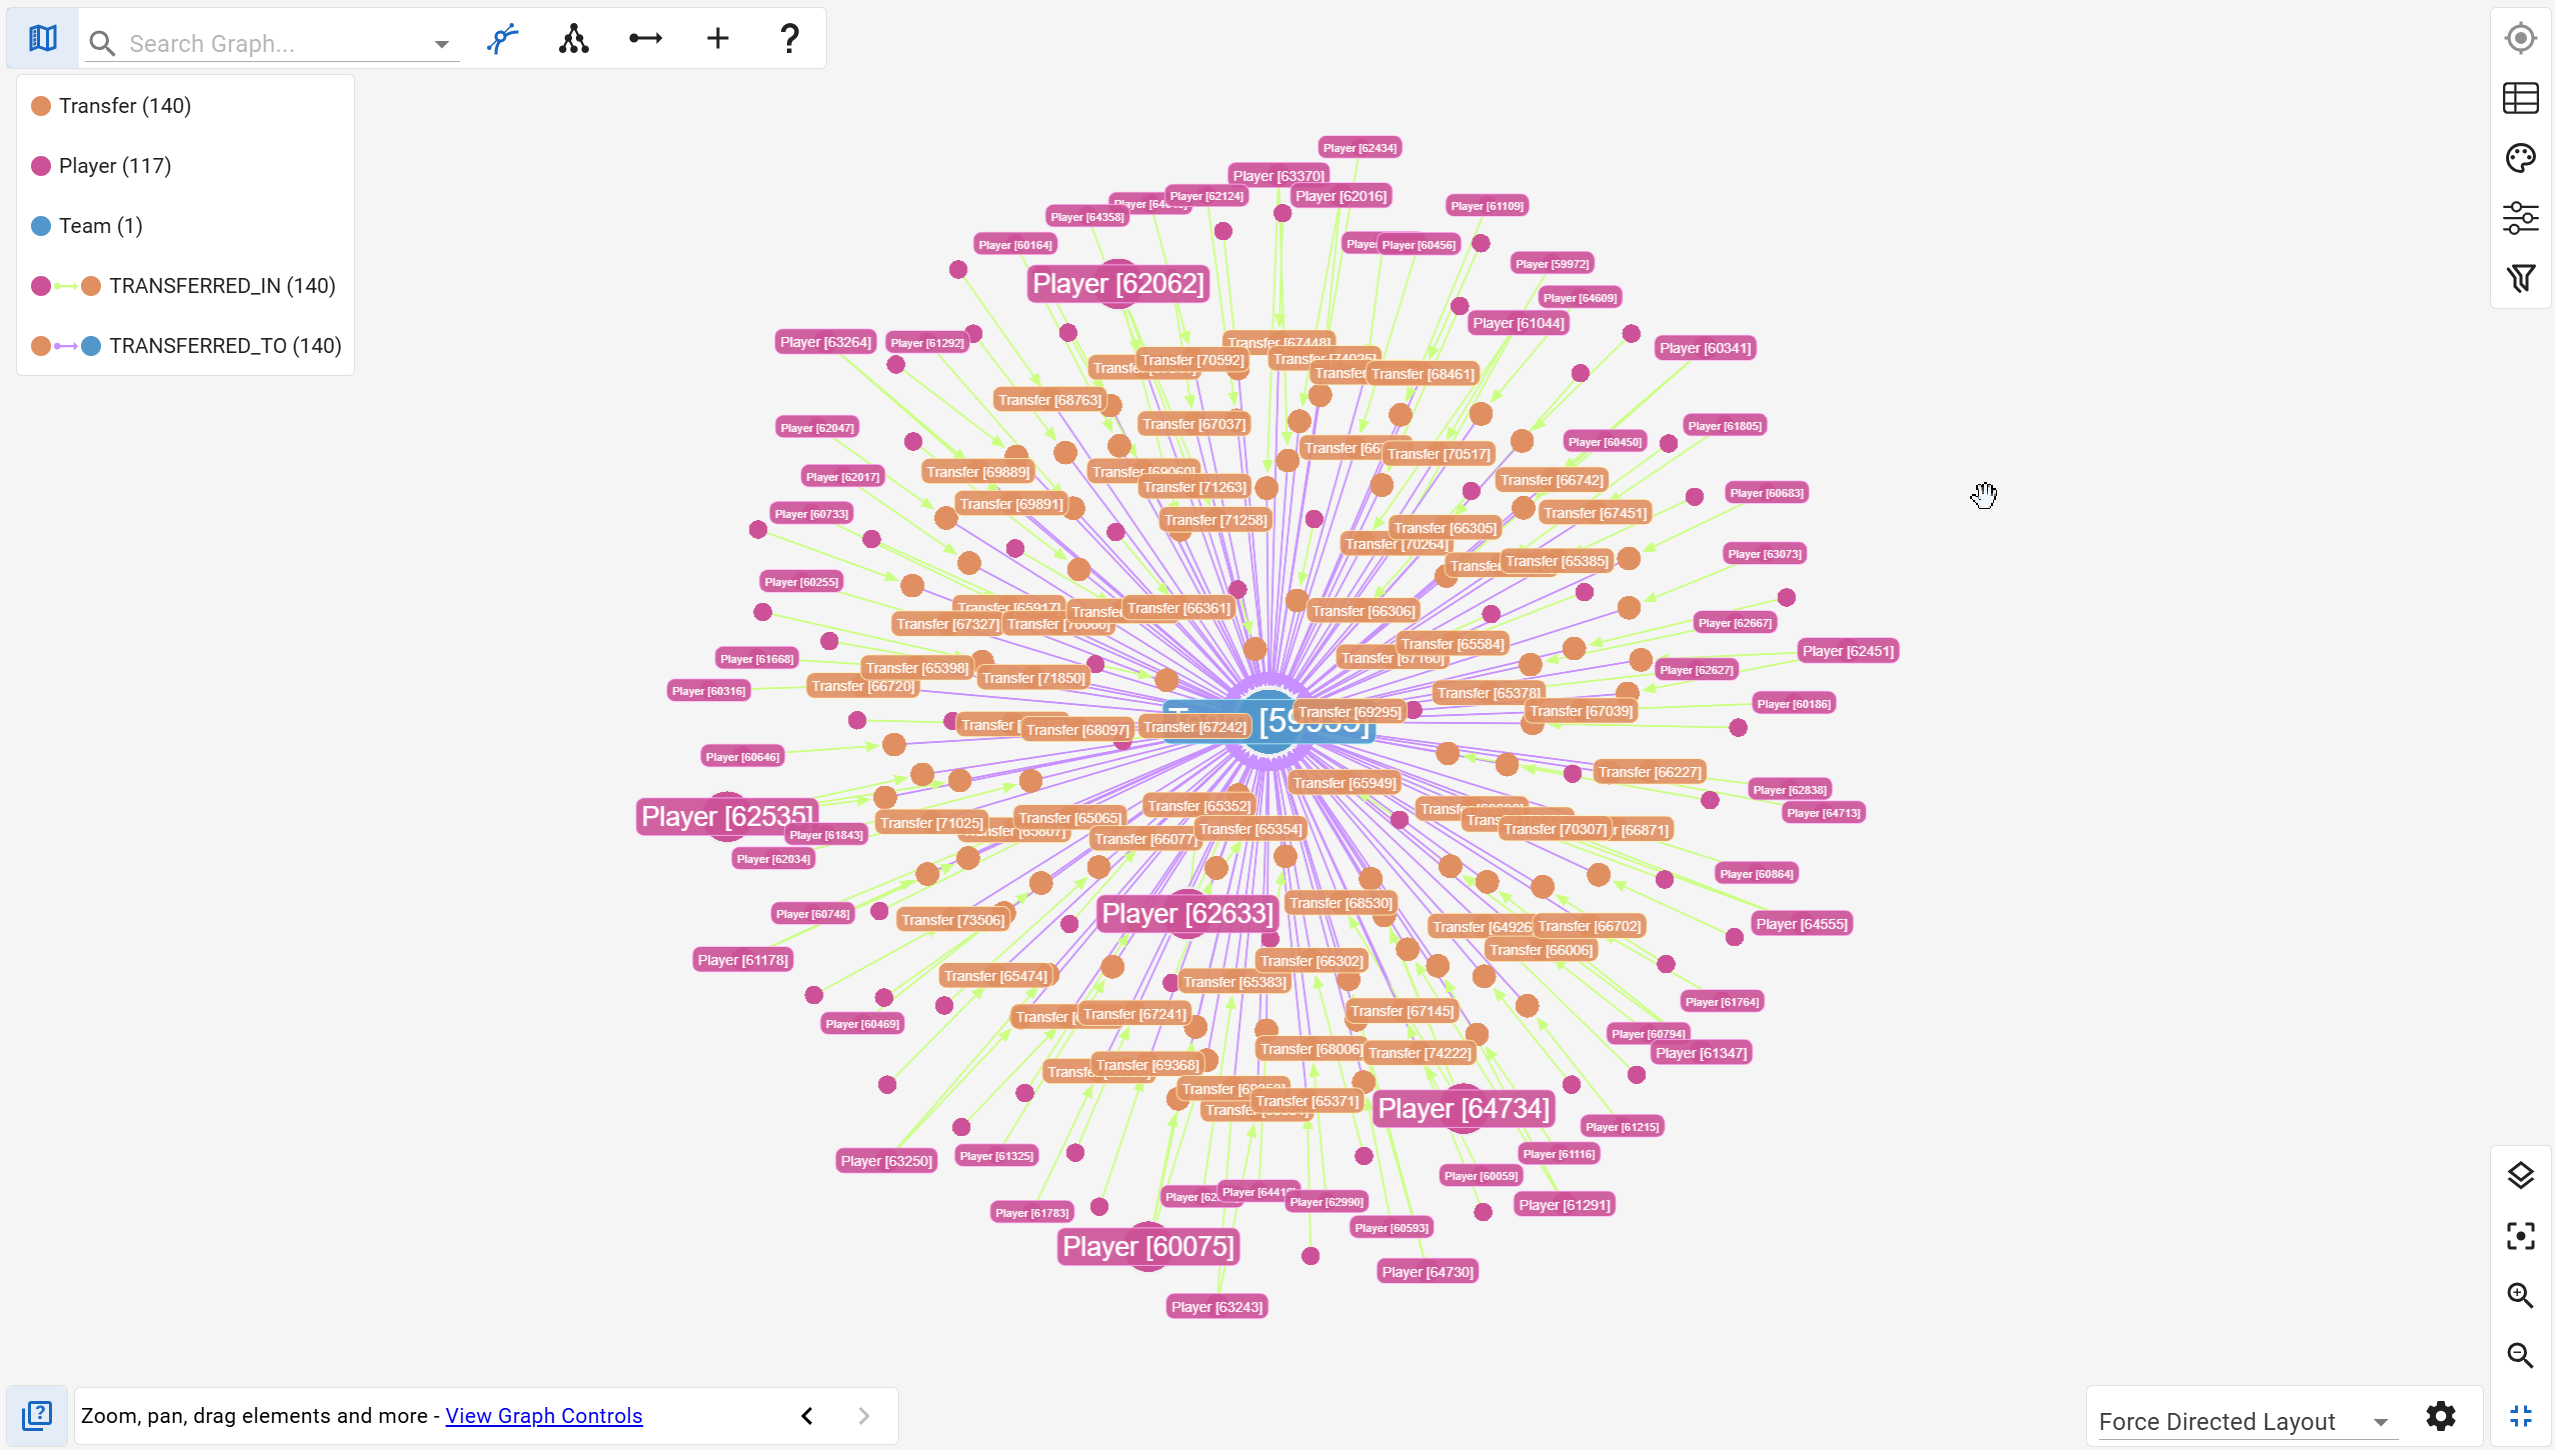
Multi-Format Graph Visualization
G.V() allows you to visualize query results in several formats:
- Graph View: Visual traversal and node styling
- Table View: Structured row-based outputs
- JSON View: Raw data inspection
- Summary View: Metadata and performance stats
See the available visualization formats here:
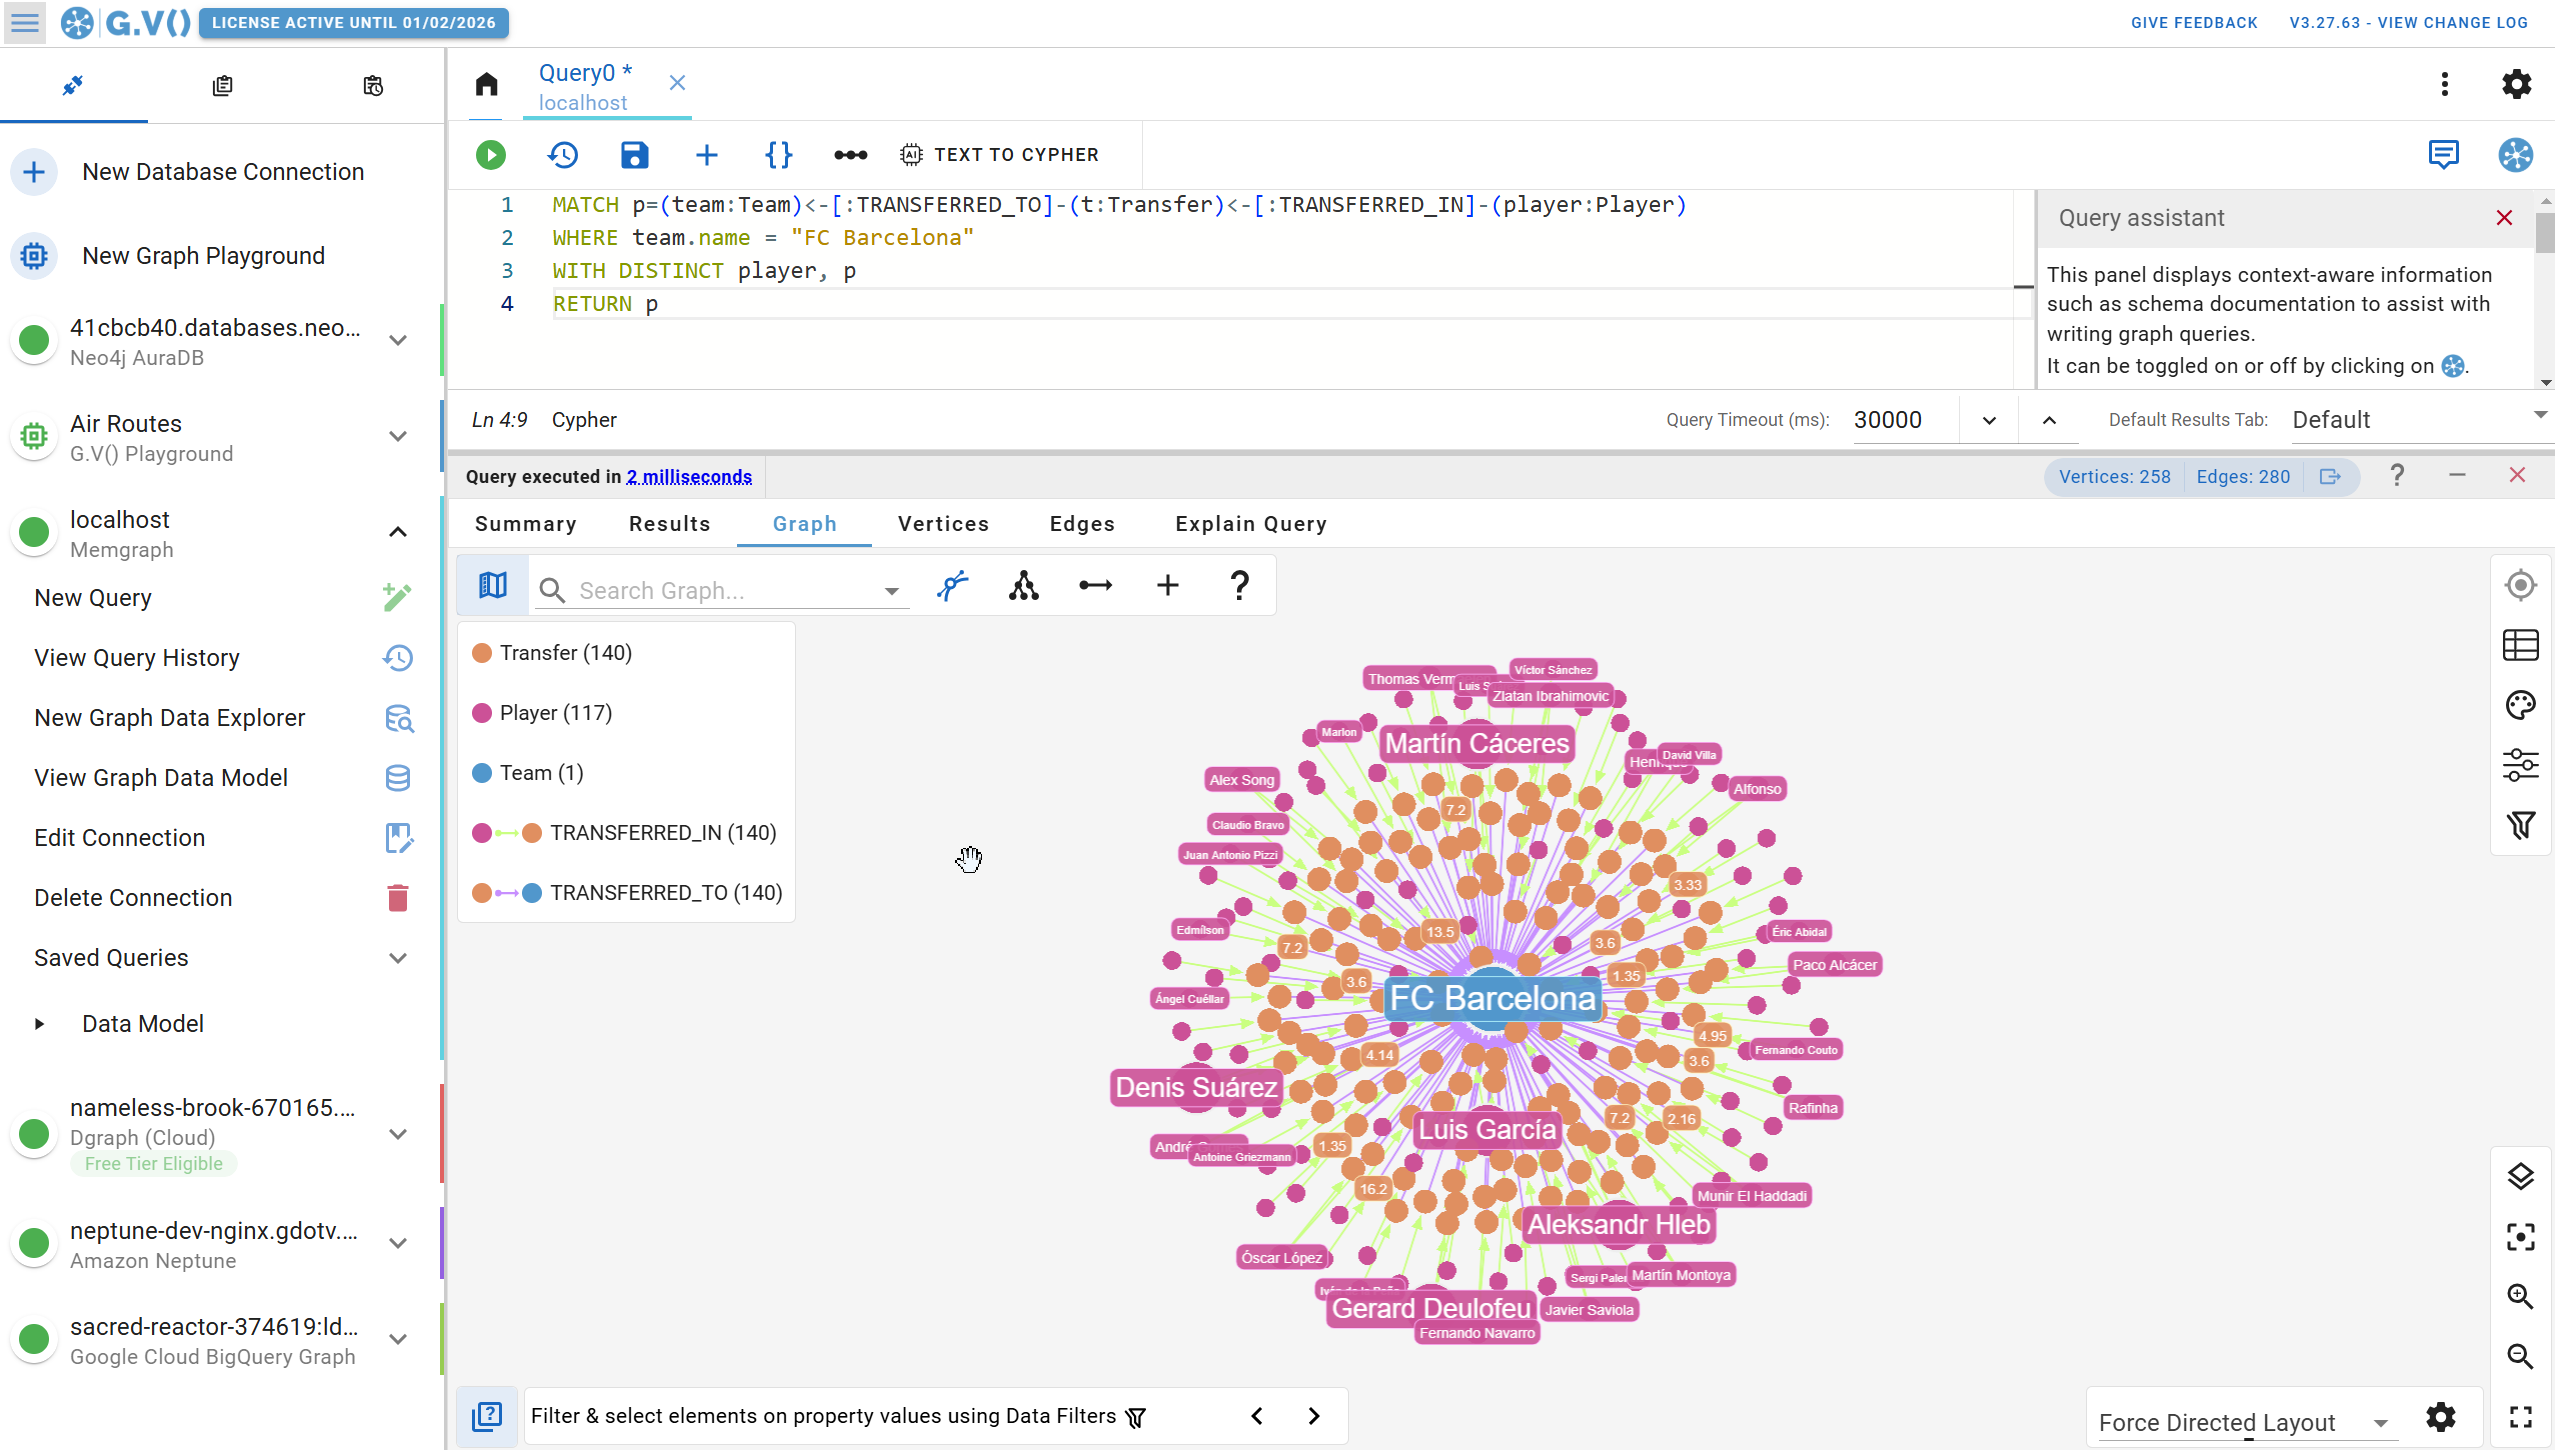
You can also customize your graph visualization using stylesheets, layouts, and filters to better match your workflow.
G.V() also supports query profiling through its Explain Query feature. It lets you inspect the query execution plan and pinpoint potential performance issues before the query is executed.
Visualize Your Evolving Graph Data Model
As your graph grows, so does the complexity of its structure, especially when multiple teams are contributing data or the model shifts over time. G.V() helps you keep track of it all with an automatically generated, interactive view of your graph data model.
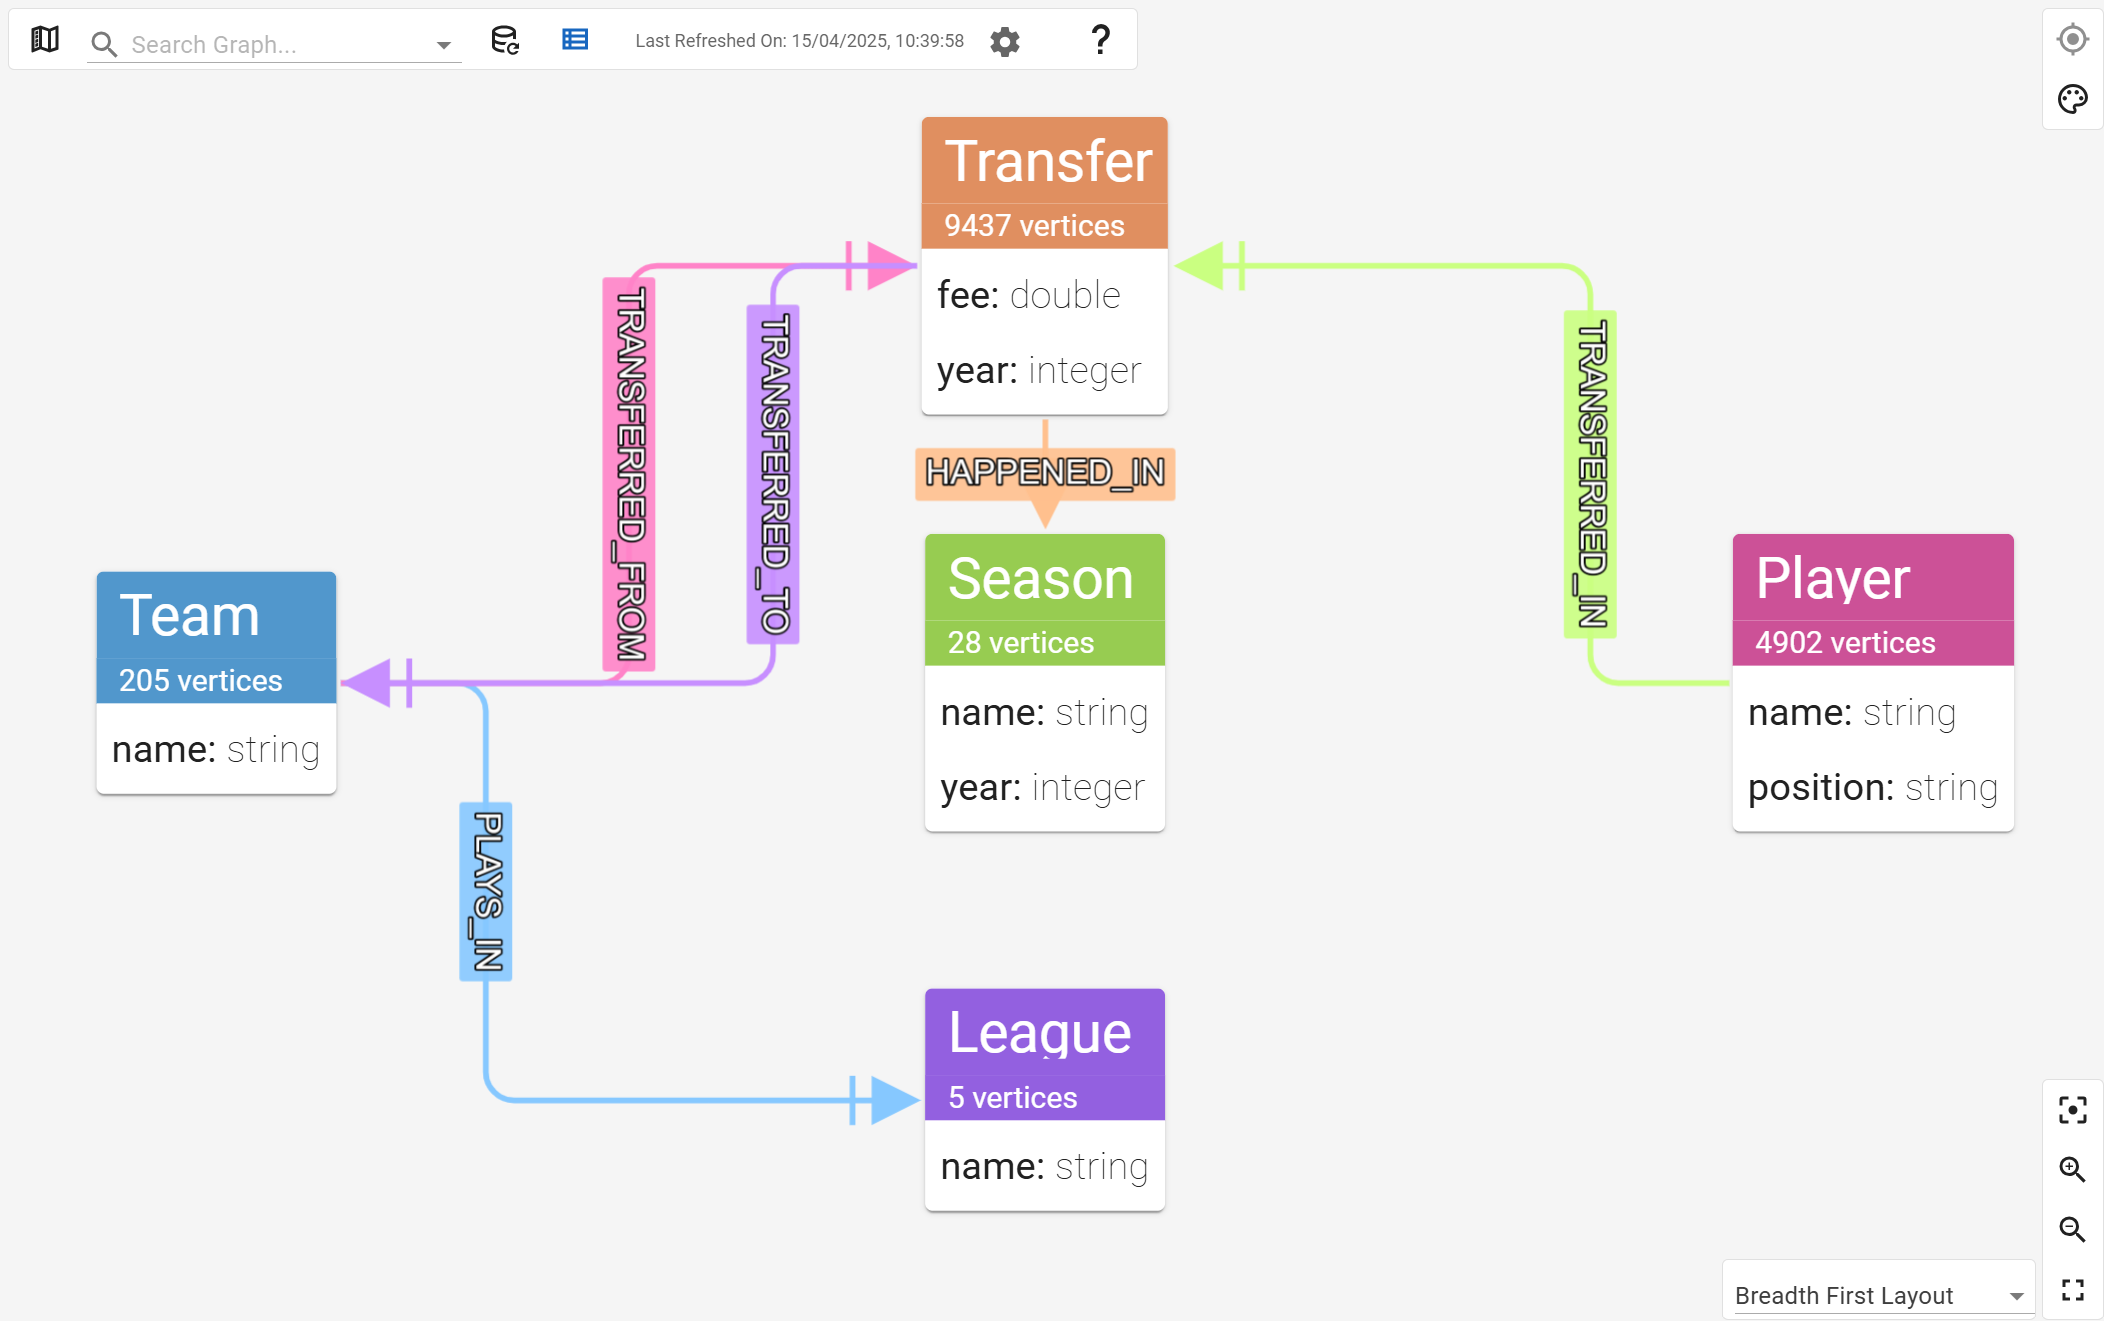
It scans your graph data and displays all node labels, relationship types, and their counts in an easy-to-understand, visual format.
Explore & Edit Your Memgraph Data
G.V()'s Graph Data Explorer allows for interactive exploration of your graph data. You can select and load specific elements, applying filters based on properties or labels as needed.
Here’s an example of the Graph Data Explorer in use:
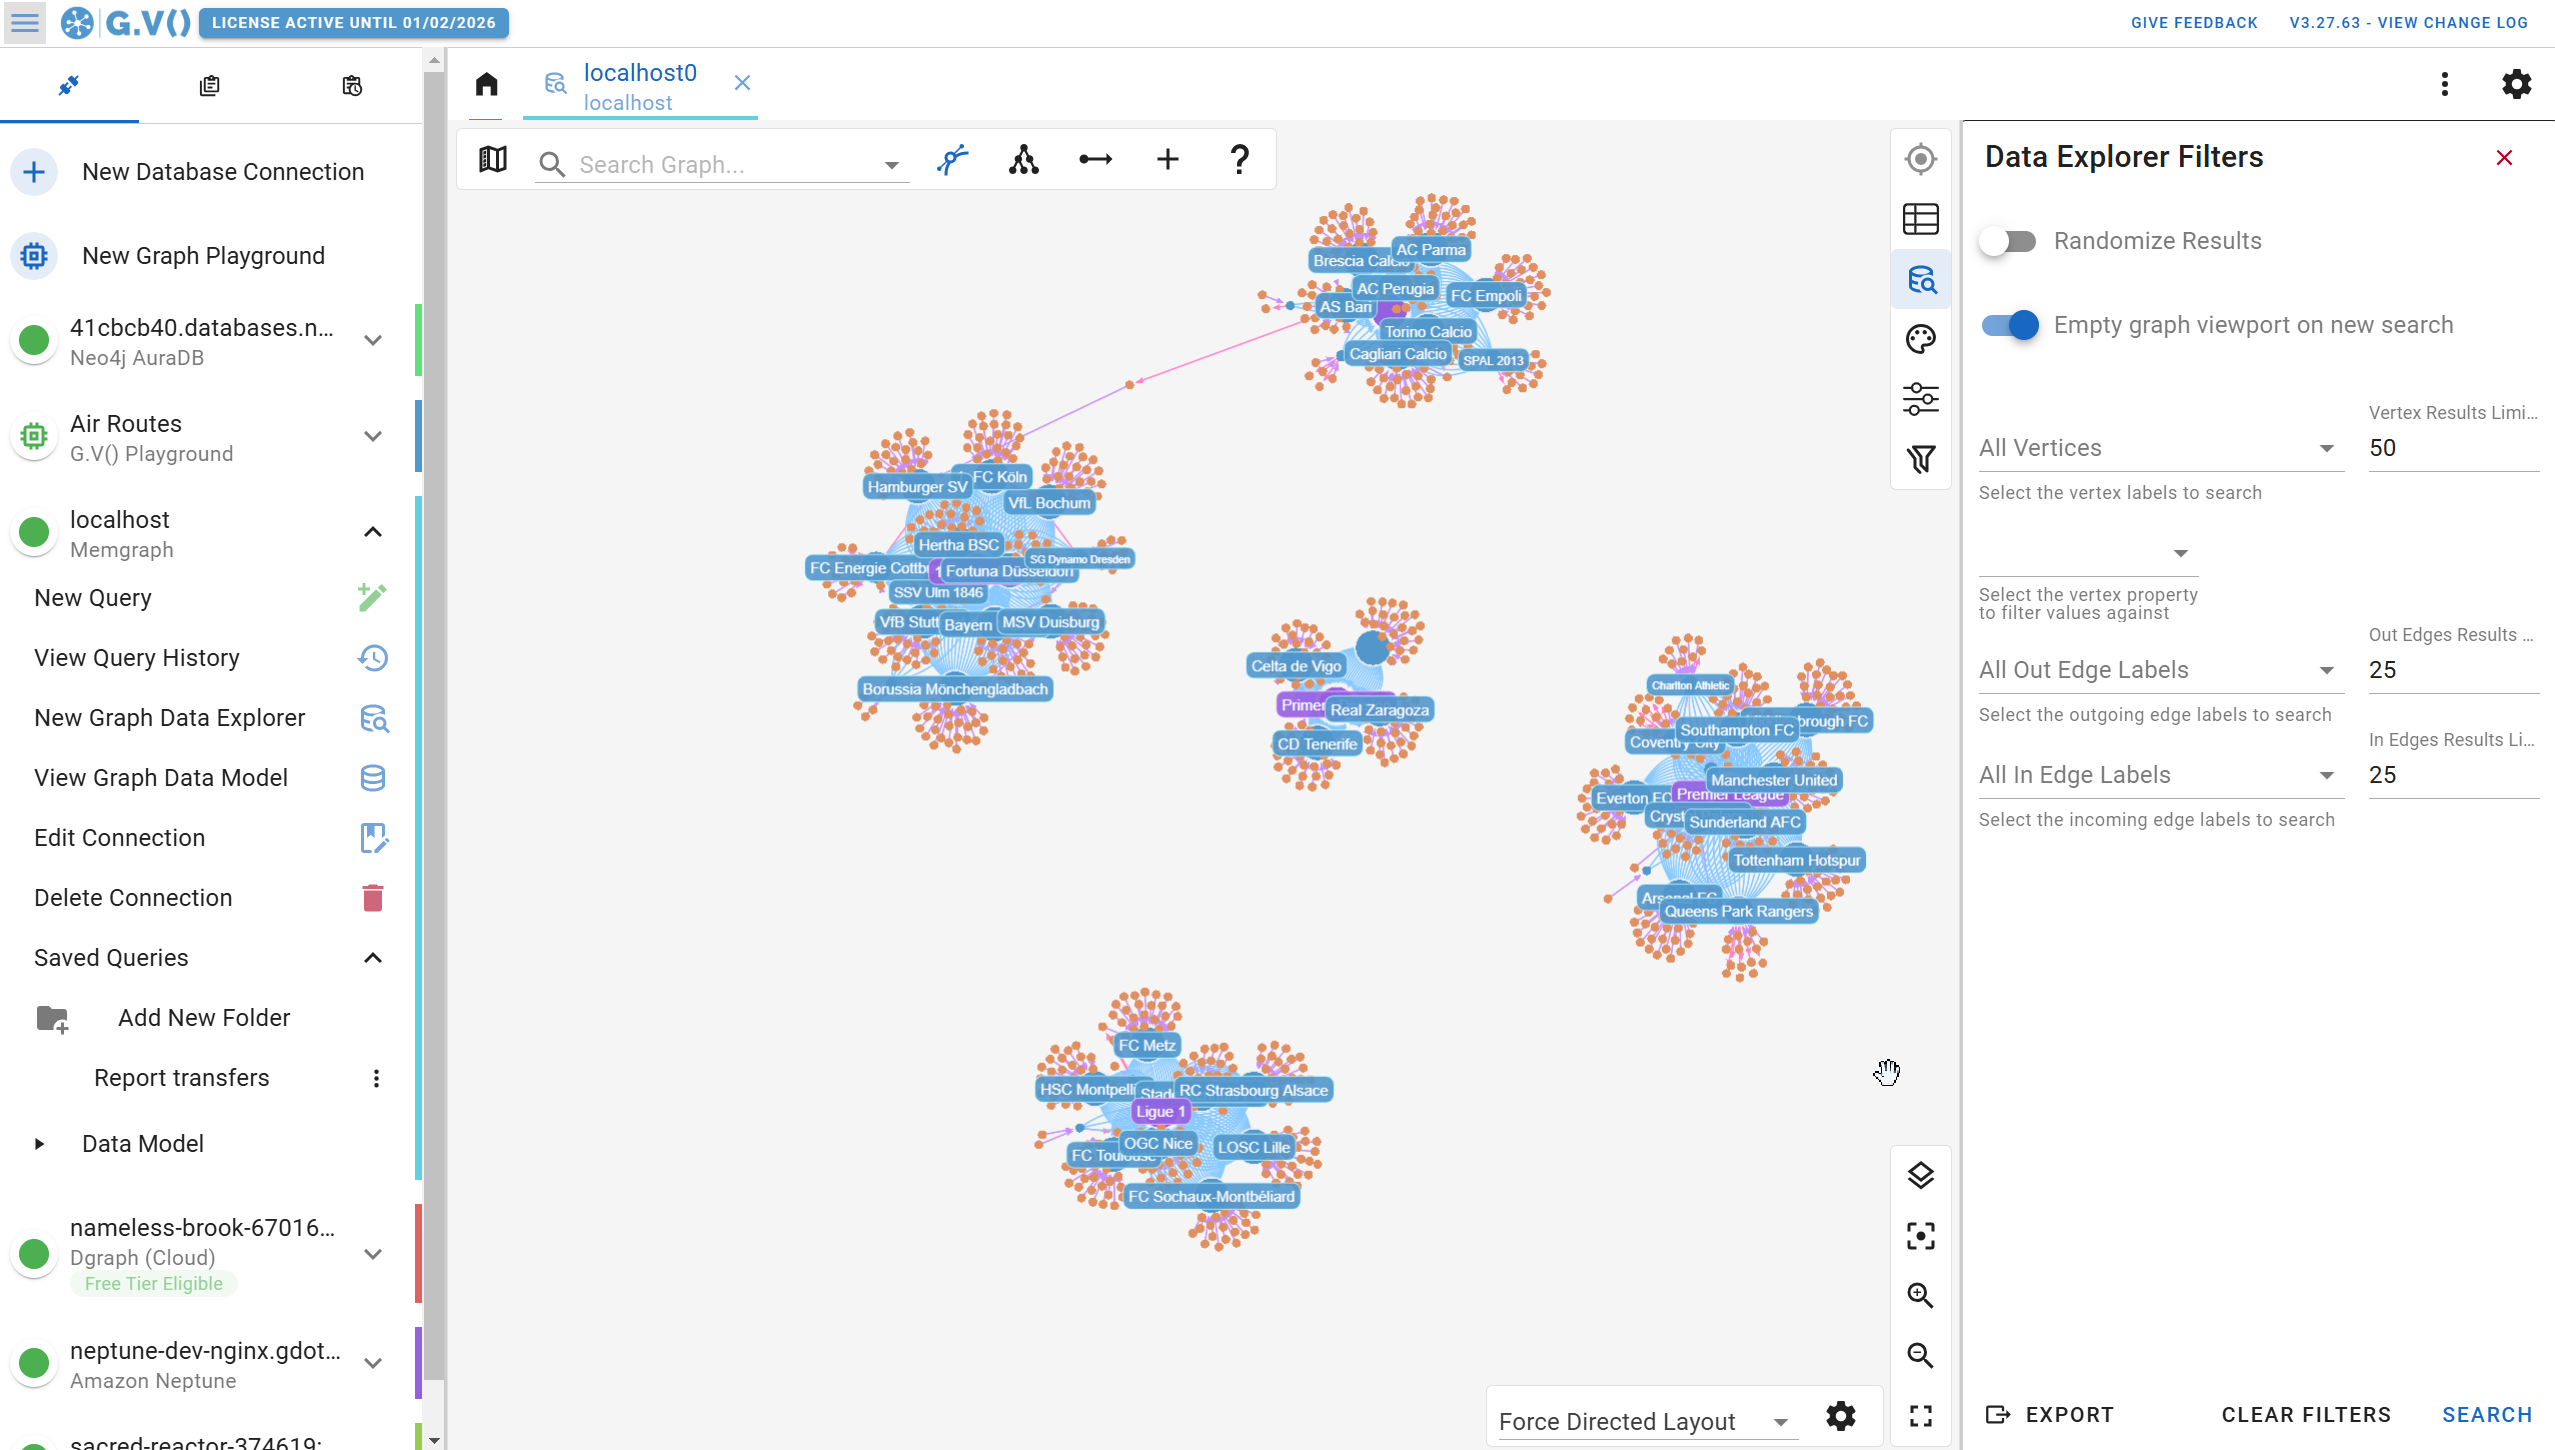
The interactive interface means you can click on elements to load connected data and continue filtering as you explore. You also have the option to edit data directly while you're exploring it.
Multiple Query Tabs
Need to run several queries at once, or compare different approaches side-by-side? G.V() supports multi-tab query editing. With it, you can work on multiple queries, explorations or any other task on a single Memgraph instance. It’s an efficient way to stay organized without jumping between windows or reloading queries.
Advanced Graph Visualization & Editing
G.V() offers a full-screen mode for graph visualization, featuring multiple layout options and fine-grained control over the display of labels, properties, and other details.
You can also edit data directly within the visualization view, with changes automatically saved to the database without requiring any additional queries.
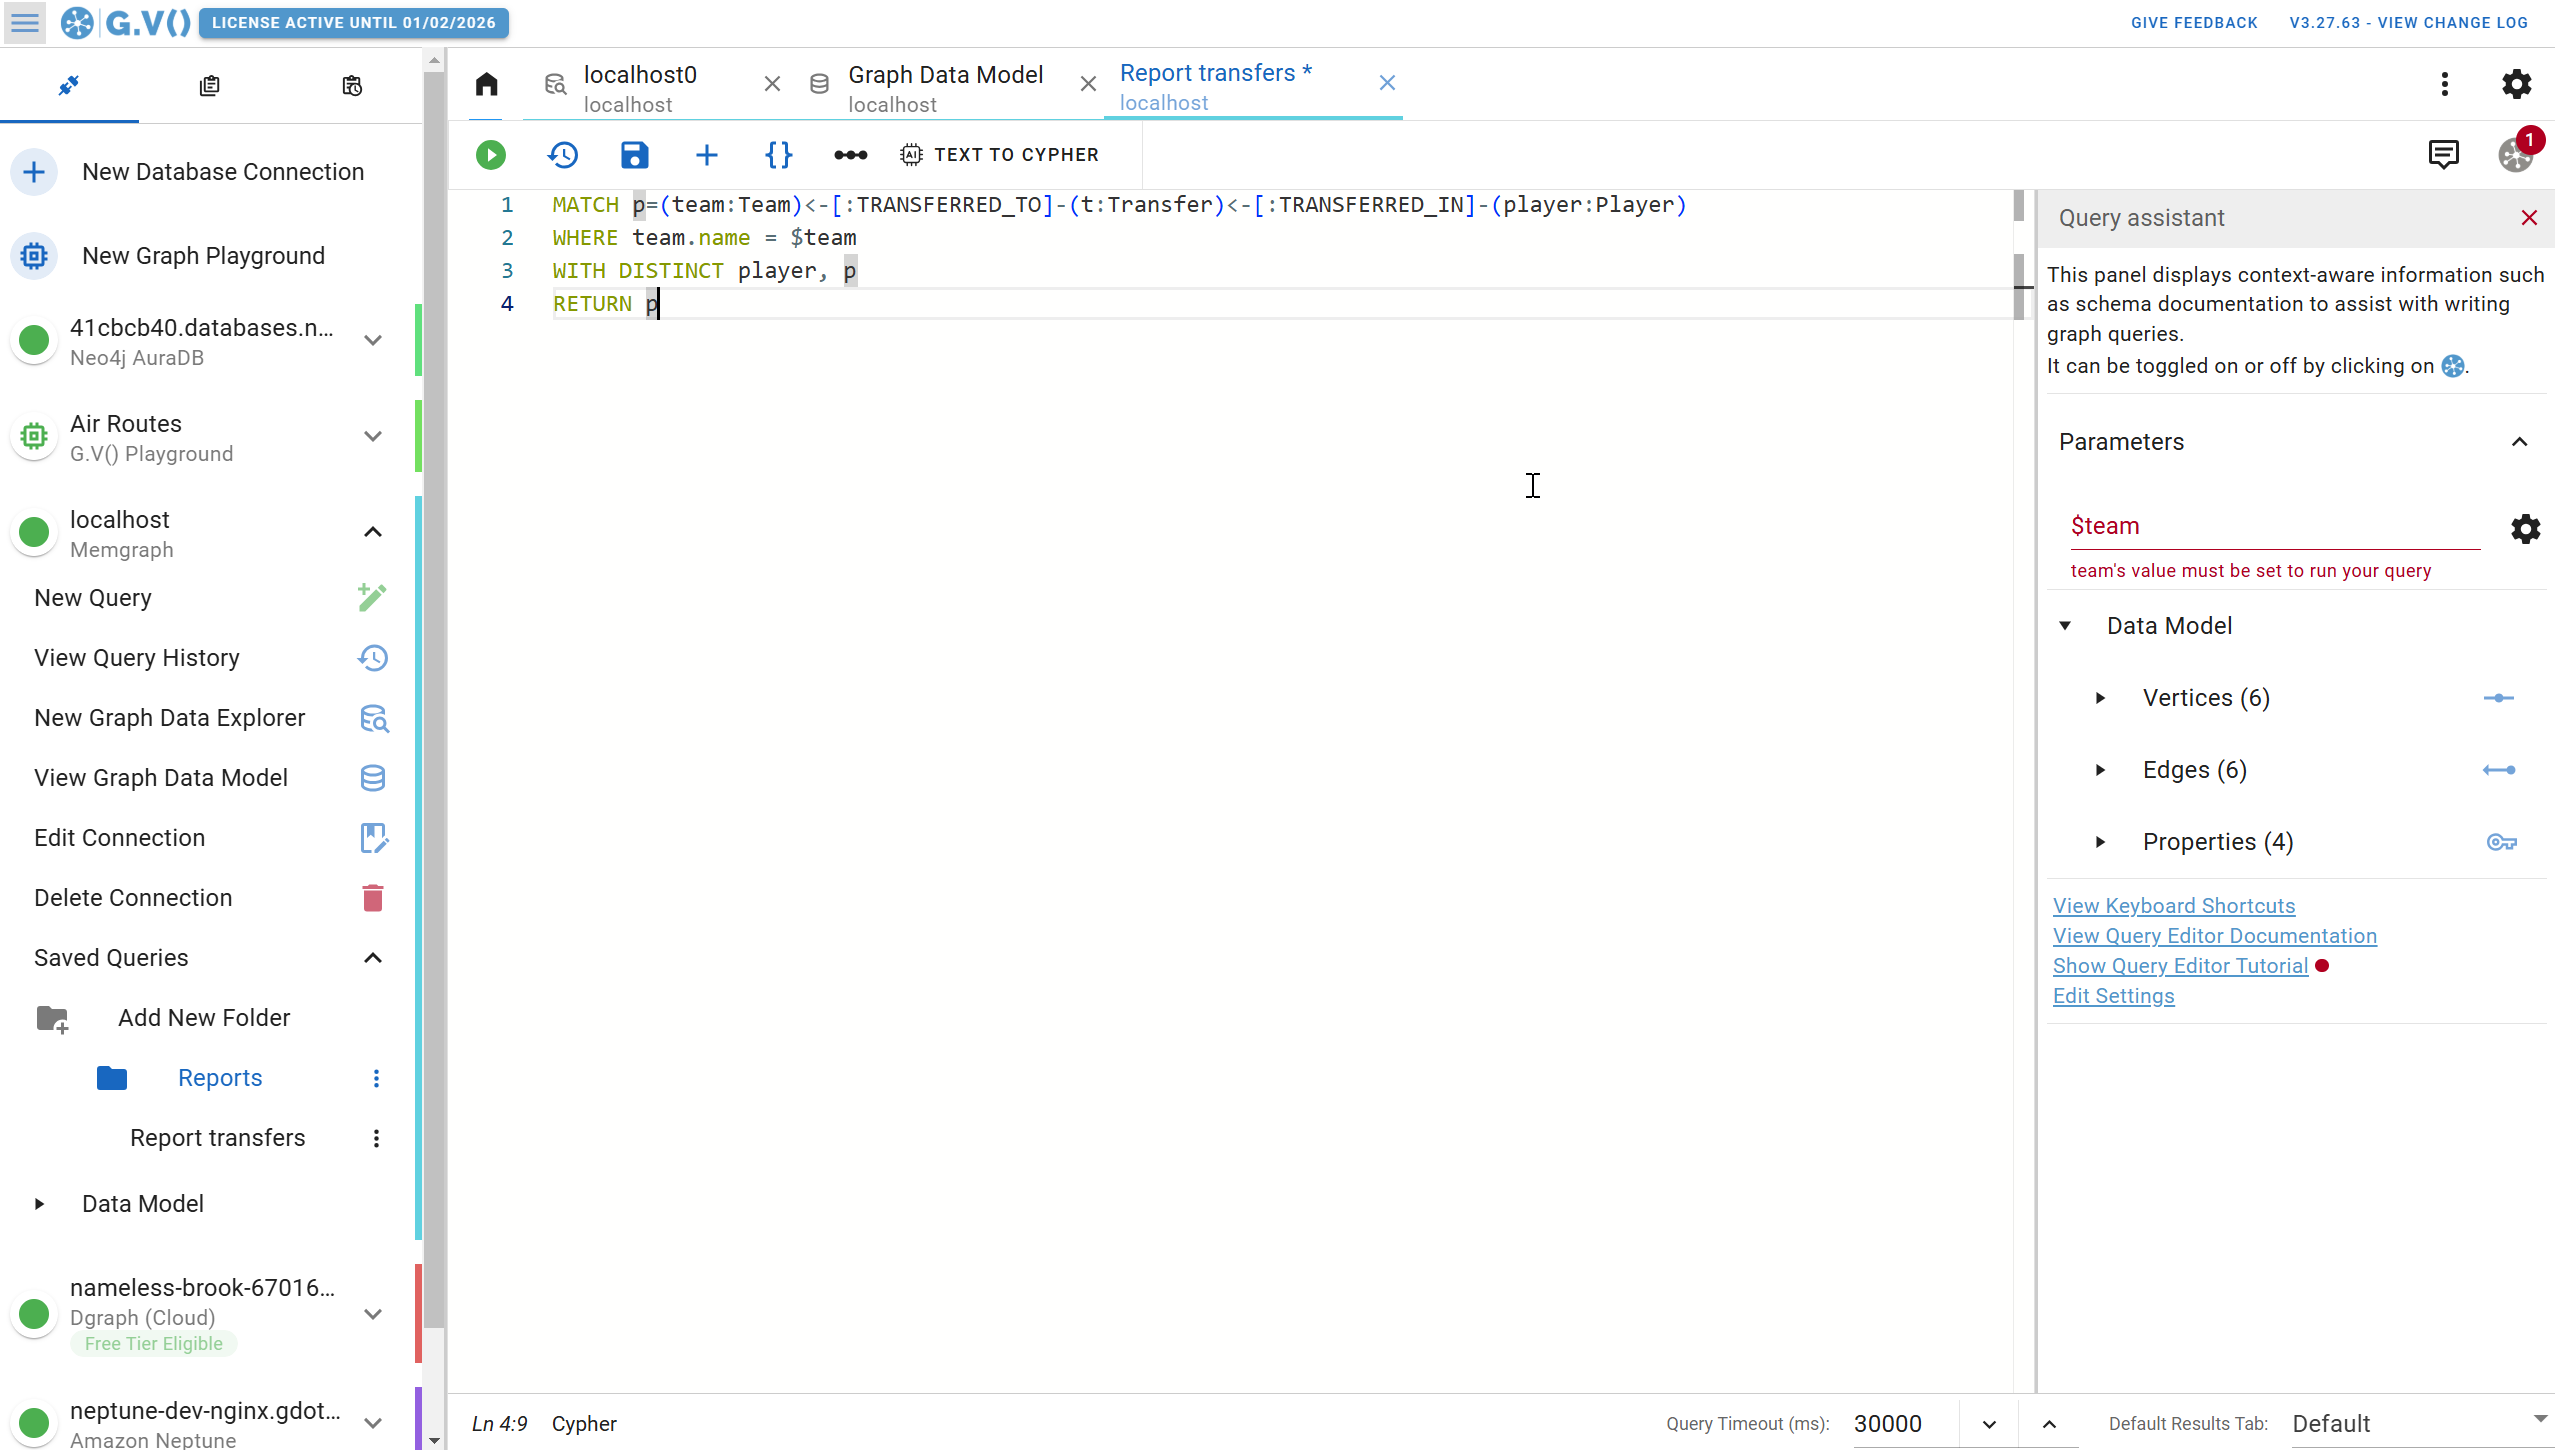
Use Query Parameters for Flexible Reporting
G.V() not only allows you to save queries as Collections but also supports query parameters. This means you can embed placeholders (like $name) in a query and easily run it repeatedly by providing different values each time.
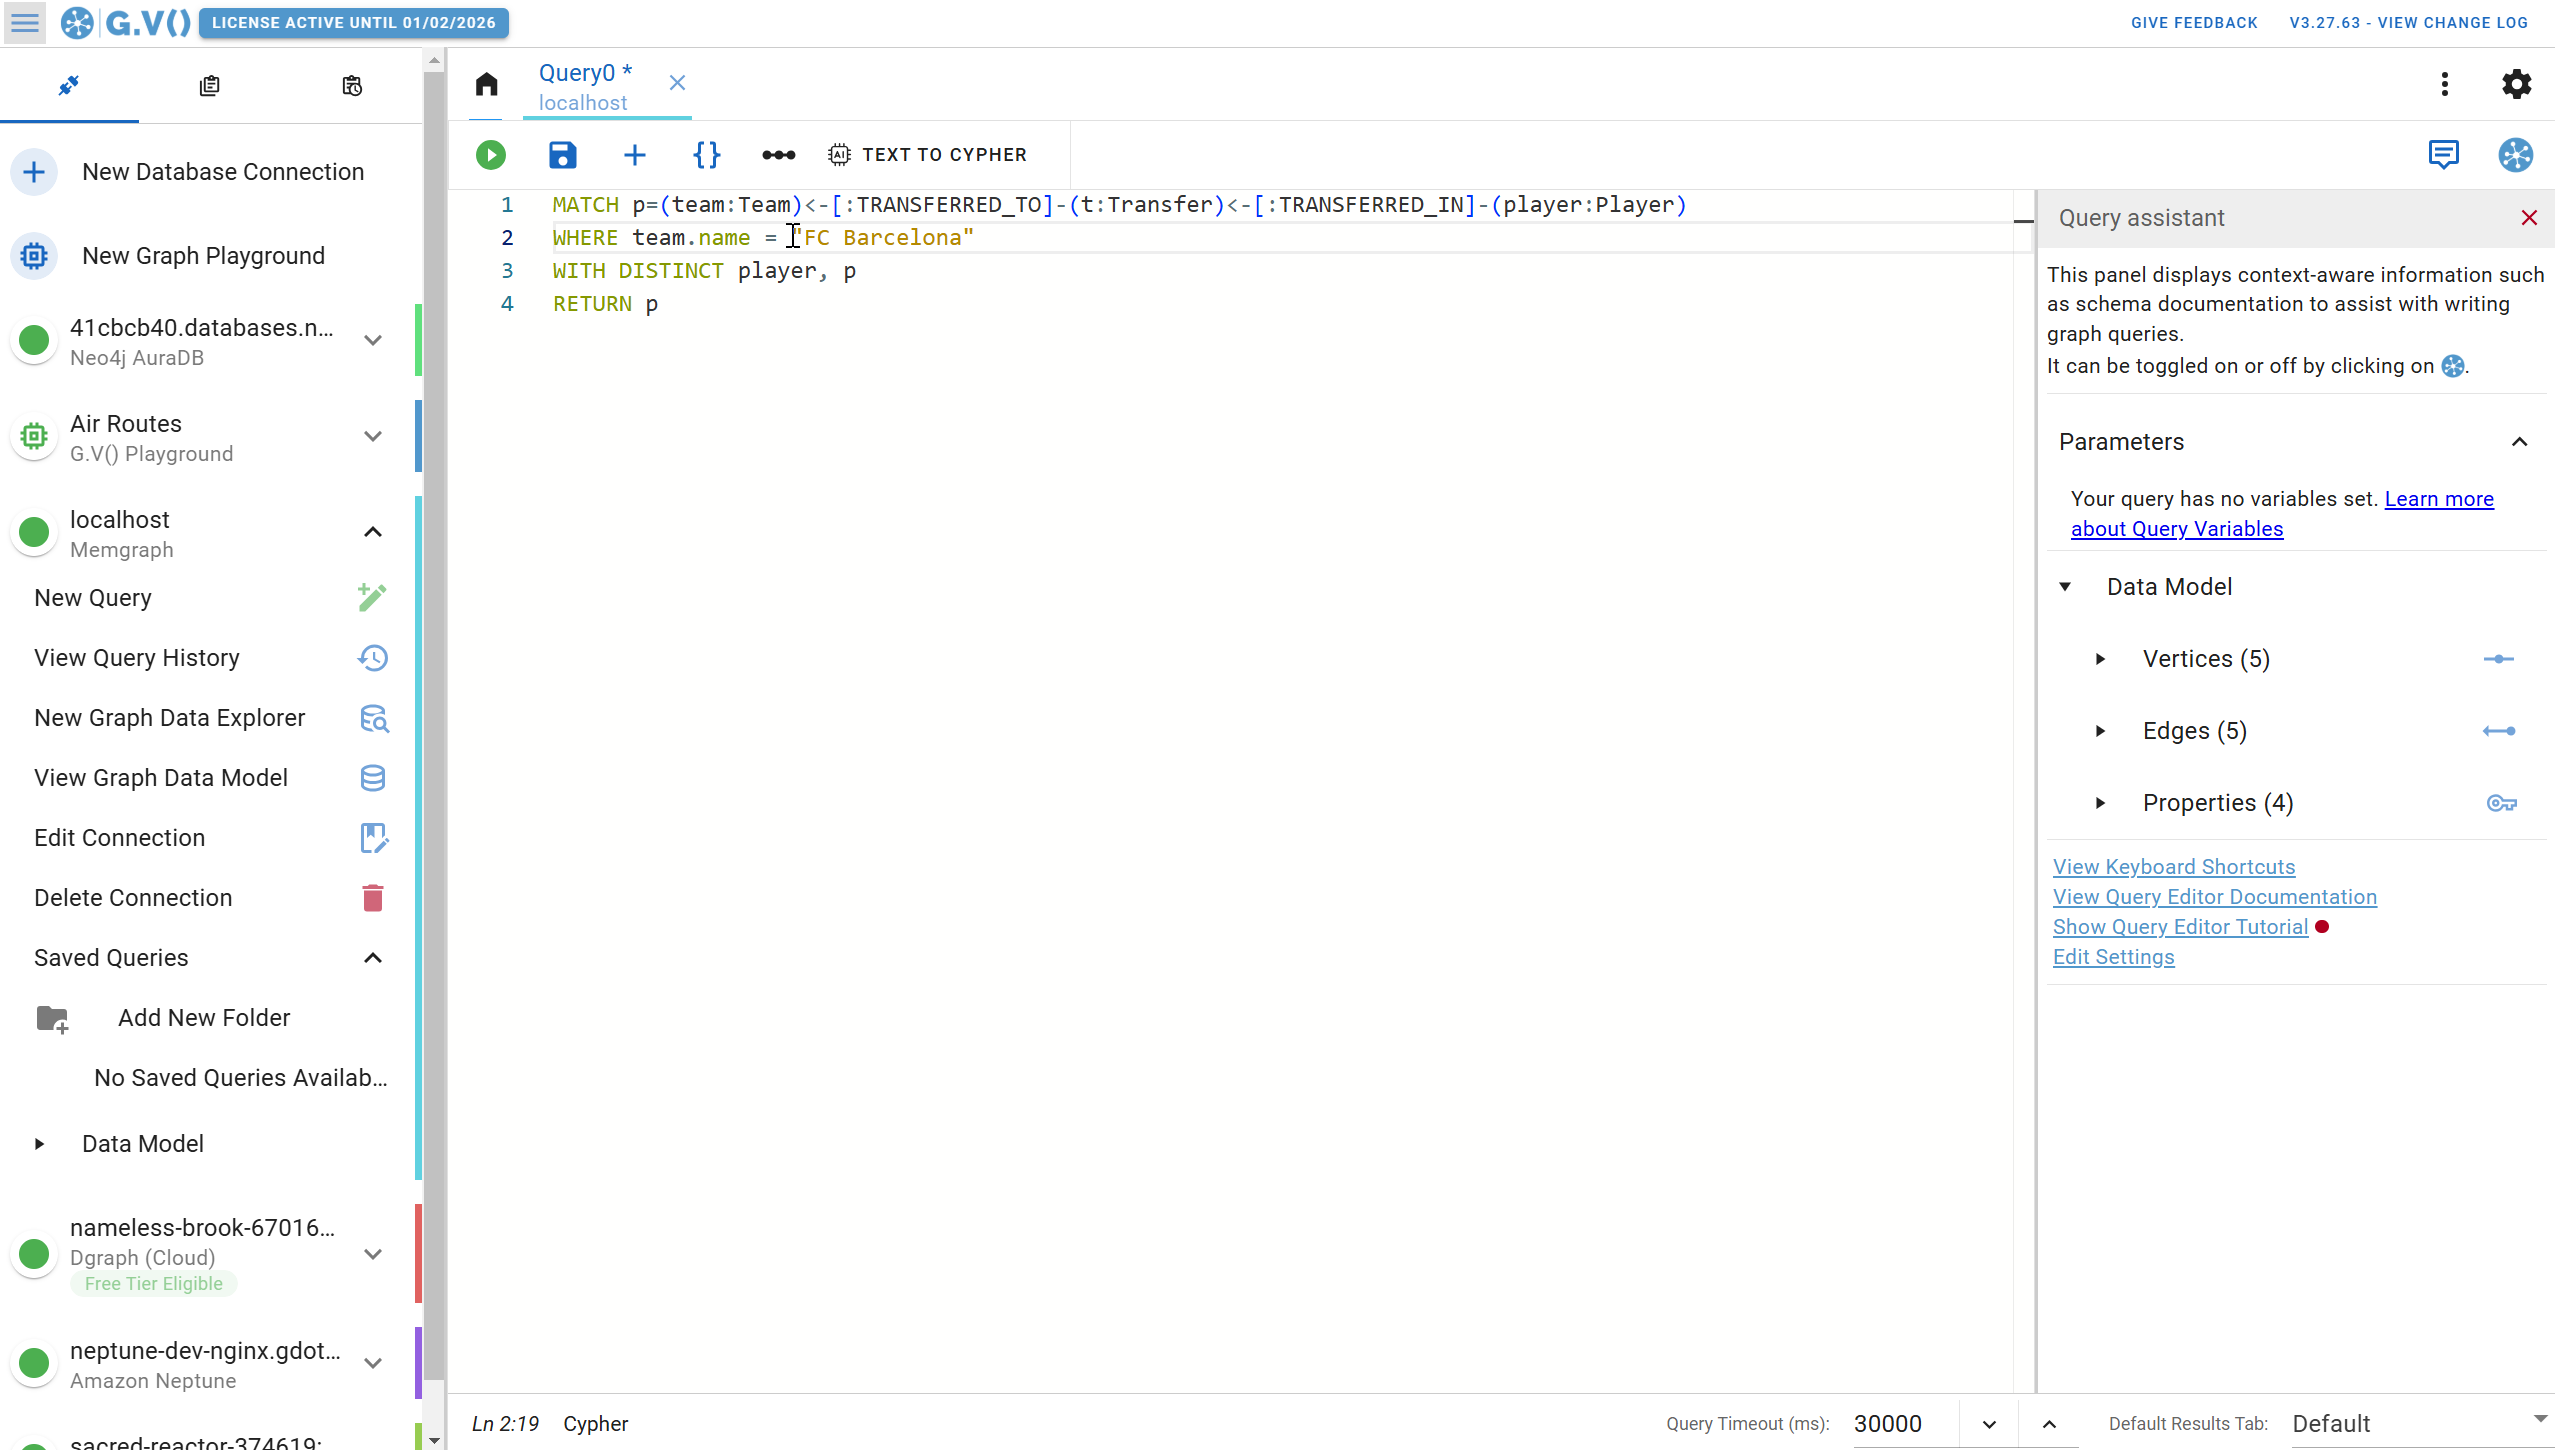
Saving these parameterized queries as reports makes it simple to rerun them with different inputs without needing to rewrite the query every time.
Wrap Up
We believe that using a tool like G.V() can significantly enhance how you visualize, explore, and interact with your data, complementing the Memgraph database. The team at G.V() is actively developing their platform, and we're glad that Memgraph is now compatible with it.
If you're looking for a client that offers interactive visualization and detailed exploration features for your Memgraph database, we recommend exploring the G.V() platform.
Want to give it a spin? Try the free version, G.V() Lite, or start a free month-long trial of G.V() Pro!