Inferring Knowledge From Unused Siloed Stores Using Graphs
Over time companies have acquired a large amount of data. Every single change and observation is logged and stored in data lakes and data warehouses. For example, online shopping platforms log all customer actions, such as purchases, liked items, items placed on the watch list, etc. All this data is gathered with the idea it will help the company move in the right direction.
But when the moment comes to actually make a step towards that right direction, for example, decide whether subscription rates should be lowered to attract more customers or the management needs to come up with any other action with a similar goal, companies are faced with the hard realization that all that data first needs to be processed and understood to become useful.
But making data useful is not an easy job. The main problem is that the gathered data is too diverse, dispersed, and stored at different volumes for the company to use it effortlessly. Just imagine how many business insights and opportunities were lost by companies trying to make sense of this complex mess of meaningless, siloed data and content, and failing.
This failure represents the inability to gather and share knowledge, which ultimately slows down progress and creates inconsistencies. Organizations no longer know what they do or don’t know about their internal and external operations. Lacking this kind of knowledge prevents data scientists and their organizations from recognizing and reacting quickly to changing market conditions. Therefore, missing out on opportunities to innovate.
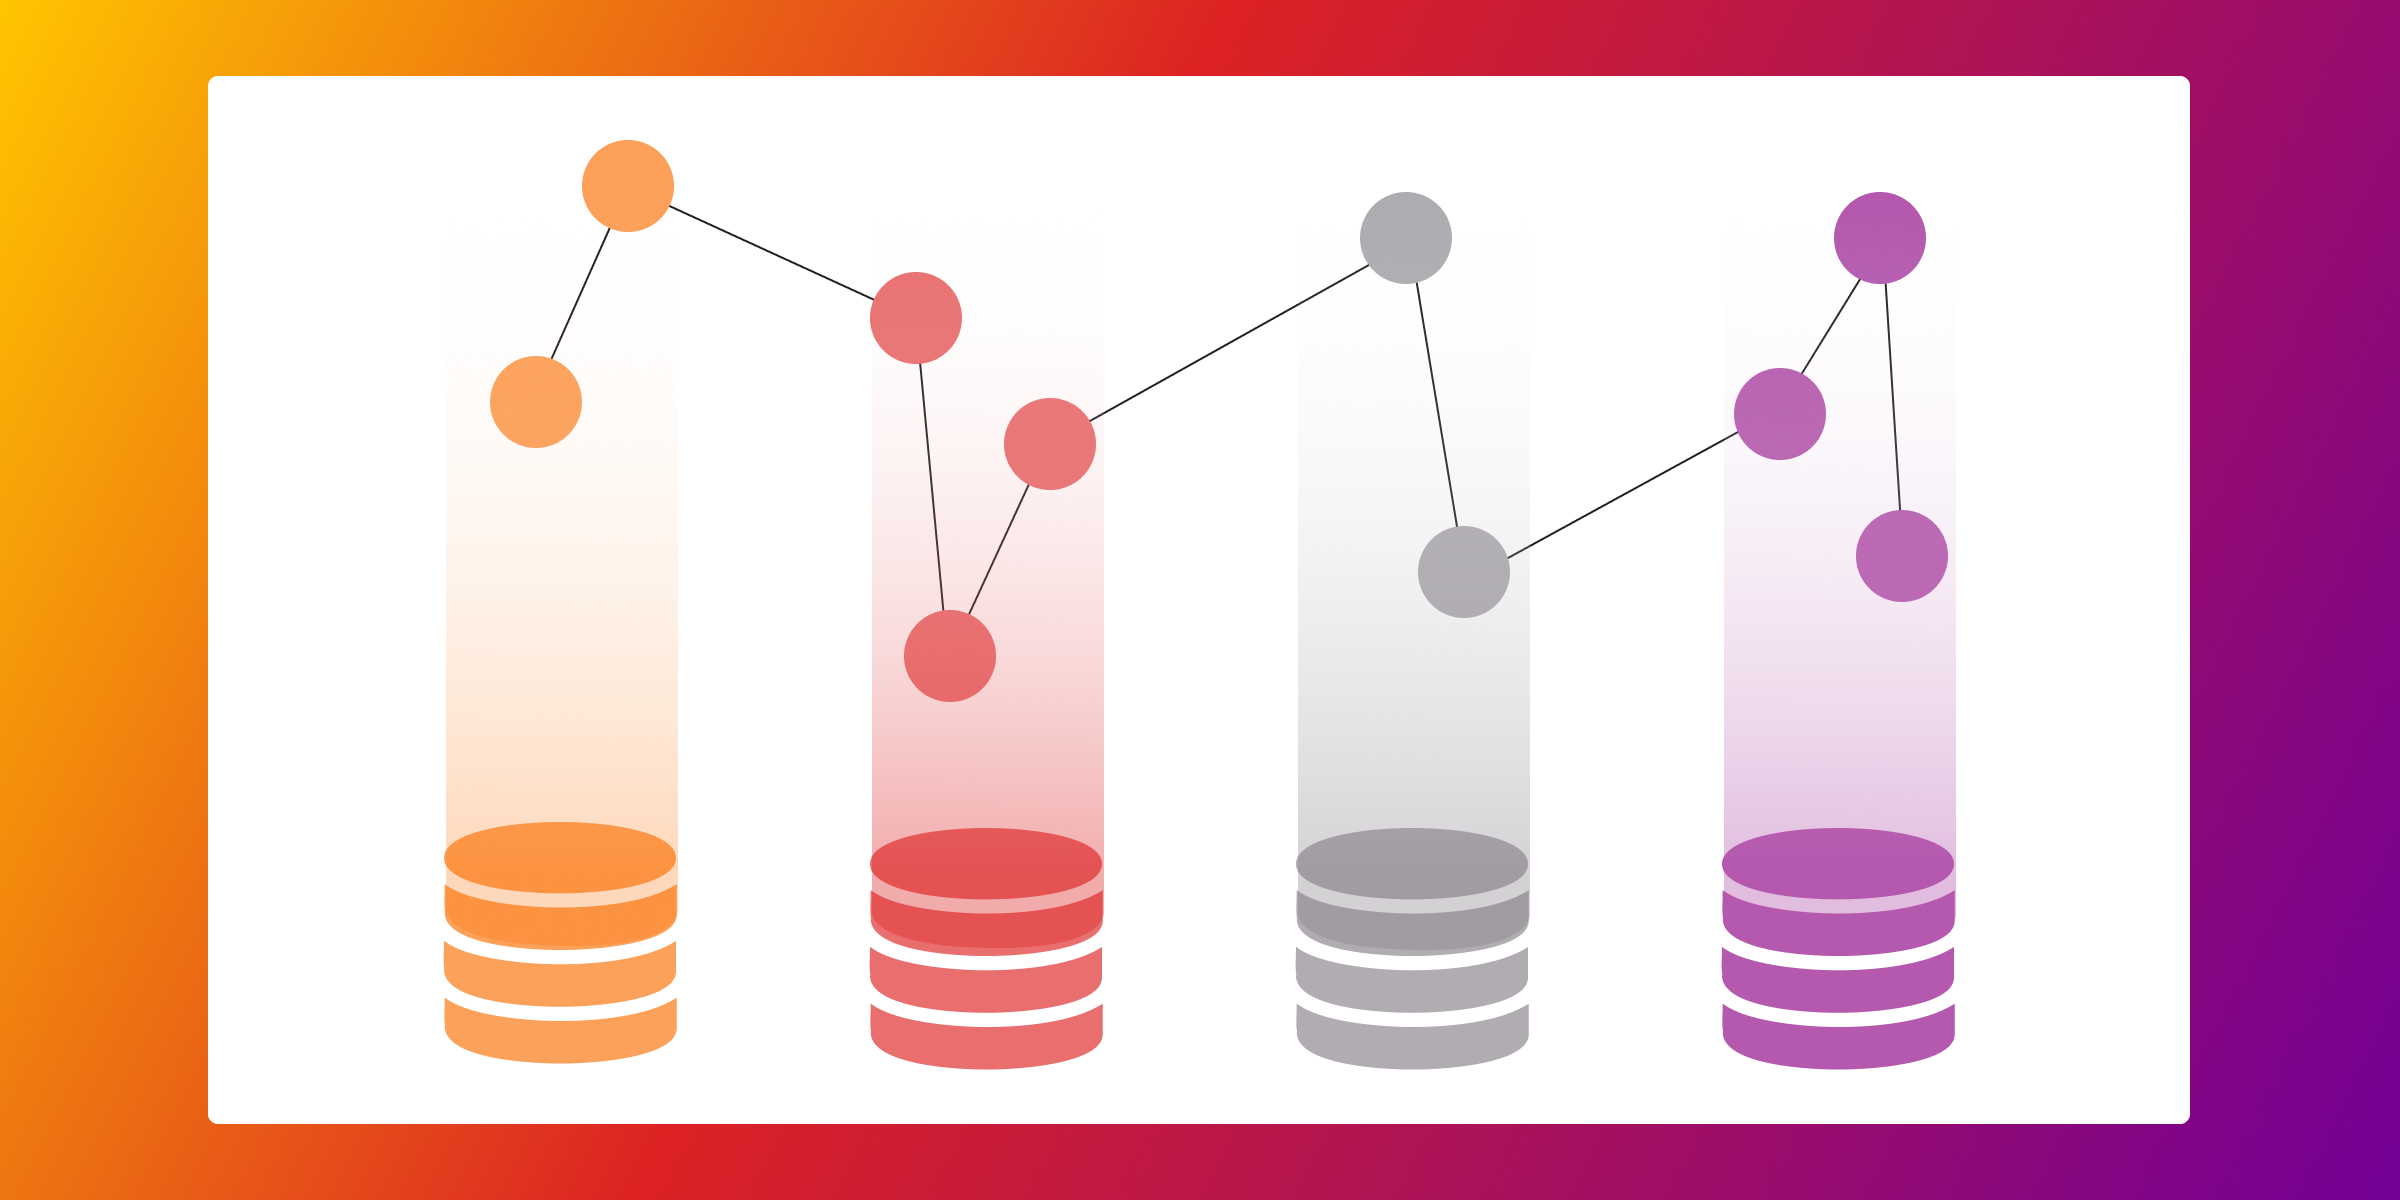
A healthy business grows and evolves driven by knowledge, and continuously seeks it out. Aging infrastructure and isolated siloed data lacking context, like the one in the picture below, is what makes the transformation of data into knowledge impossible.
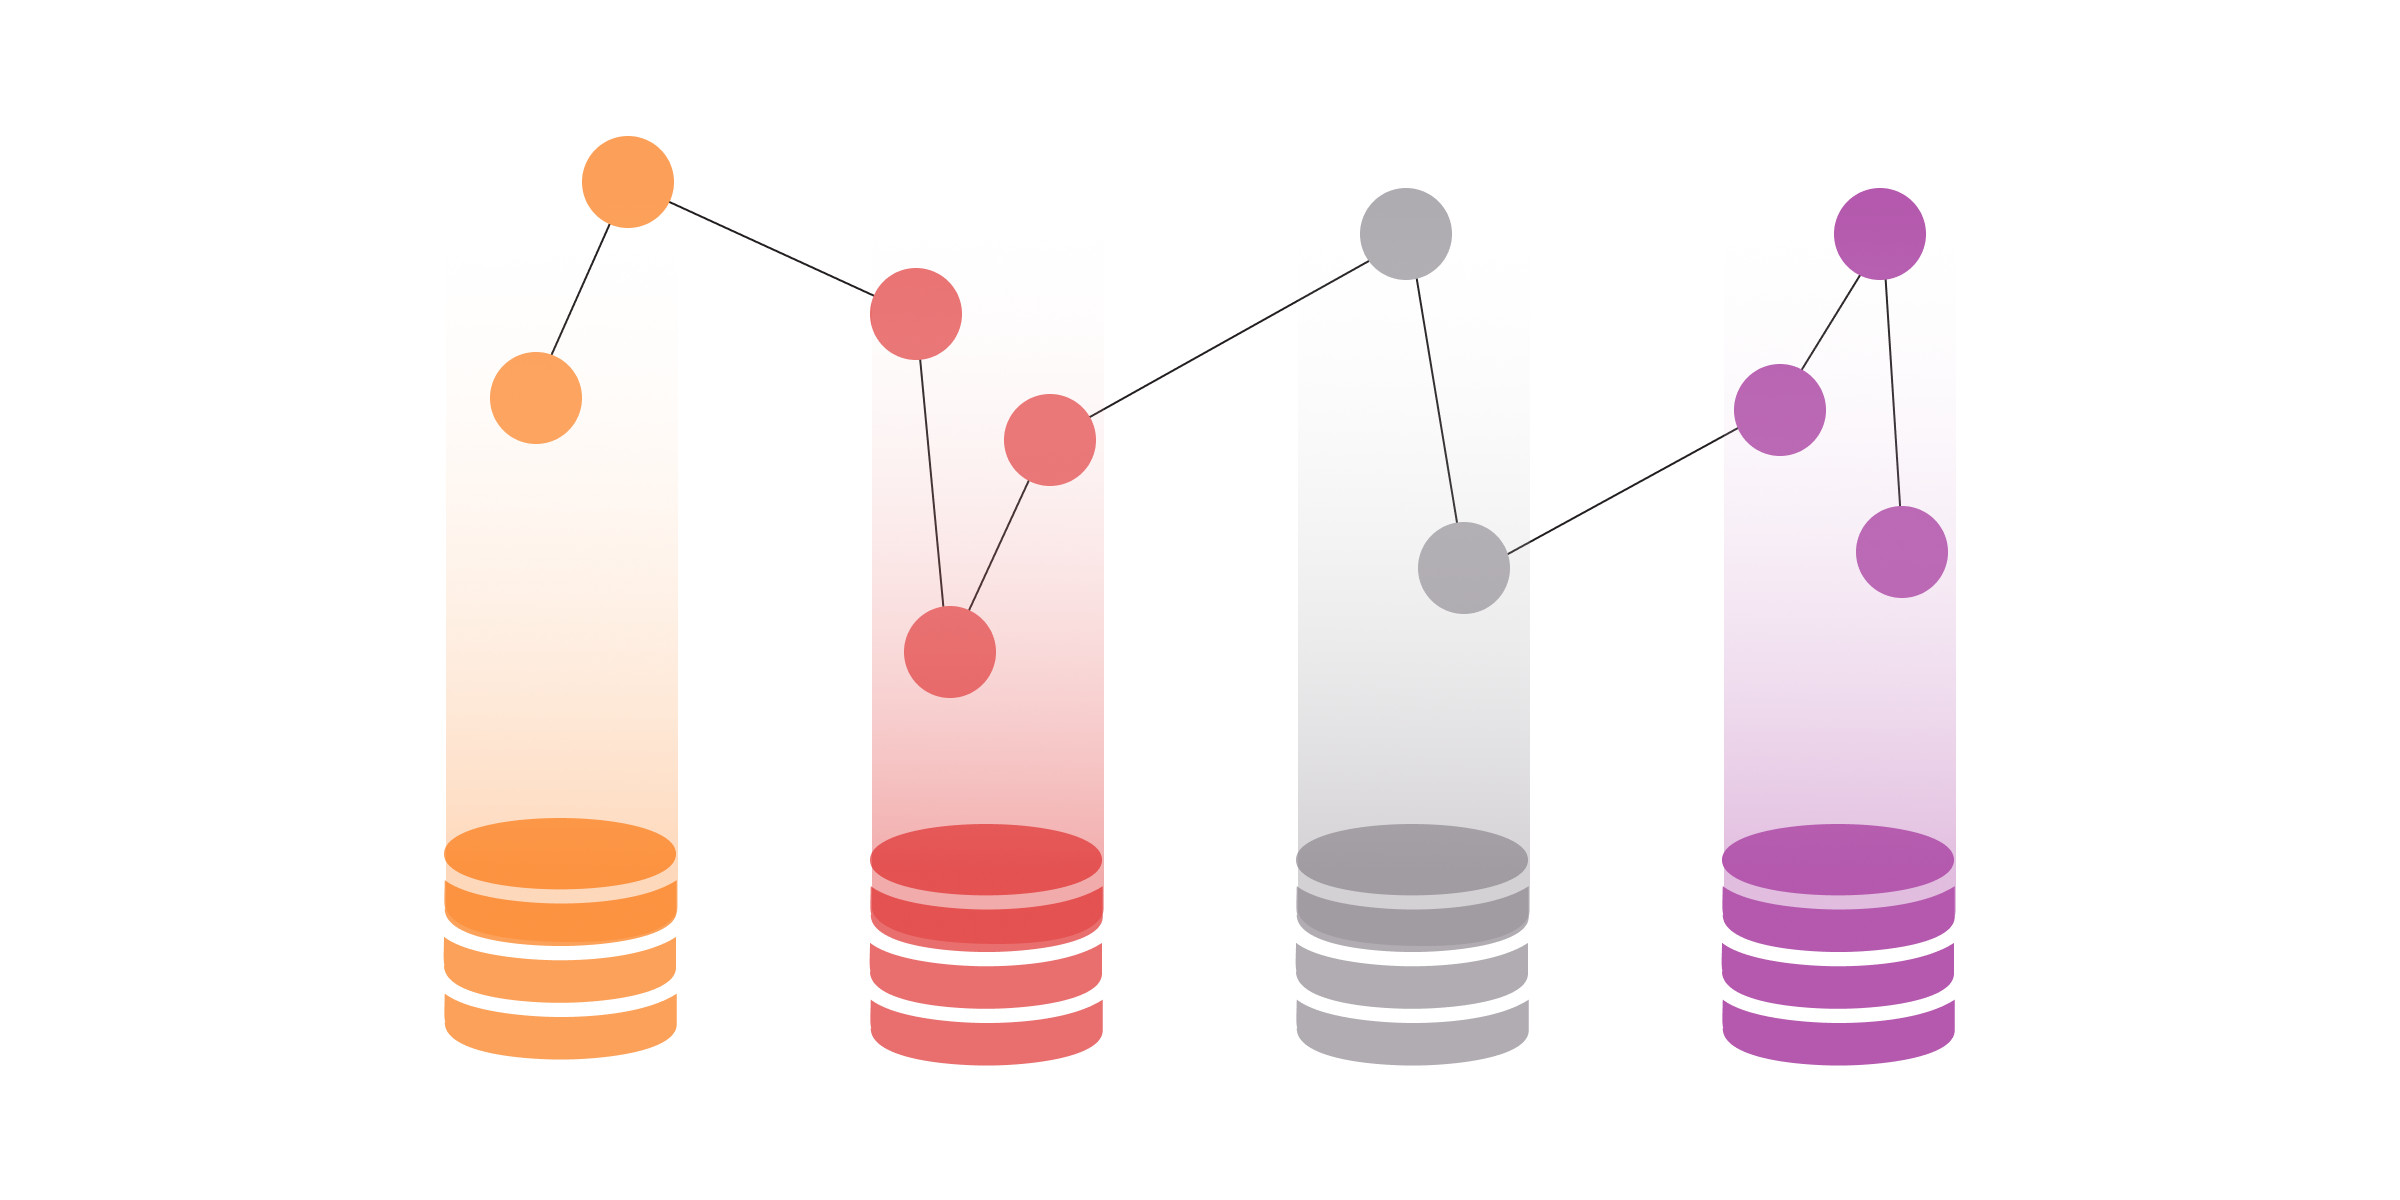
Knowledge graphs are a solution to this problem. By layering semantic metadata on top of interconnected data, an enterprise gains a uniform and consistent view of the context of its data. Data, once scattered across different systems and stakeholders, is interlinked, creating knowledge and a graph like the one in the image below.
The generated graph helps organize and collect data and metadata between different silos. But agents (people or software) can still not get a unified understanding of the data because another top-level layer is missing.
That top-level layer is a semantic description of data. By enriching the graph with a common semantic description of the data, the graph provides a higher level of abstraction that doesn't rely on the physical infrastructure or format of the data. Instead, it creates a unified way of accessing organization's data seamlessly. Data is represented in a uniform, human-friendly and meaningful way.
Such a process results in a context of what is happening across the company by creating a knowledge graph.
Where is knowledge in graph?
Knowledge-based agents are those agents who have the capability of maintaining an internal state of knowledge, reason over that knowledge, and update their knowledge after new events. And to say that graph is a knowledge graph means that its behavior enables companies to take actions that will bring them closer to their original goals.
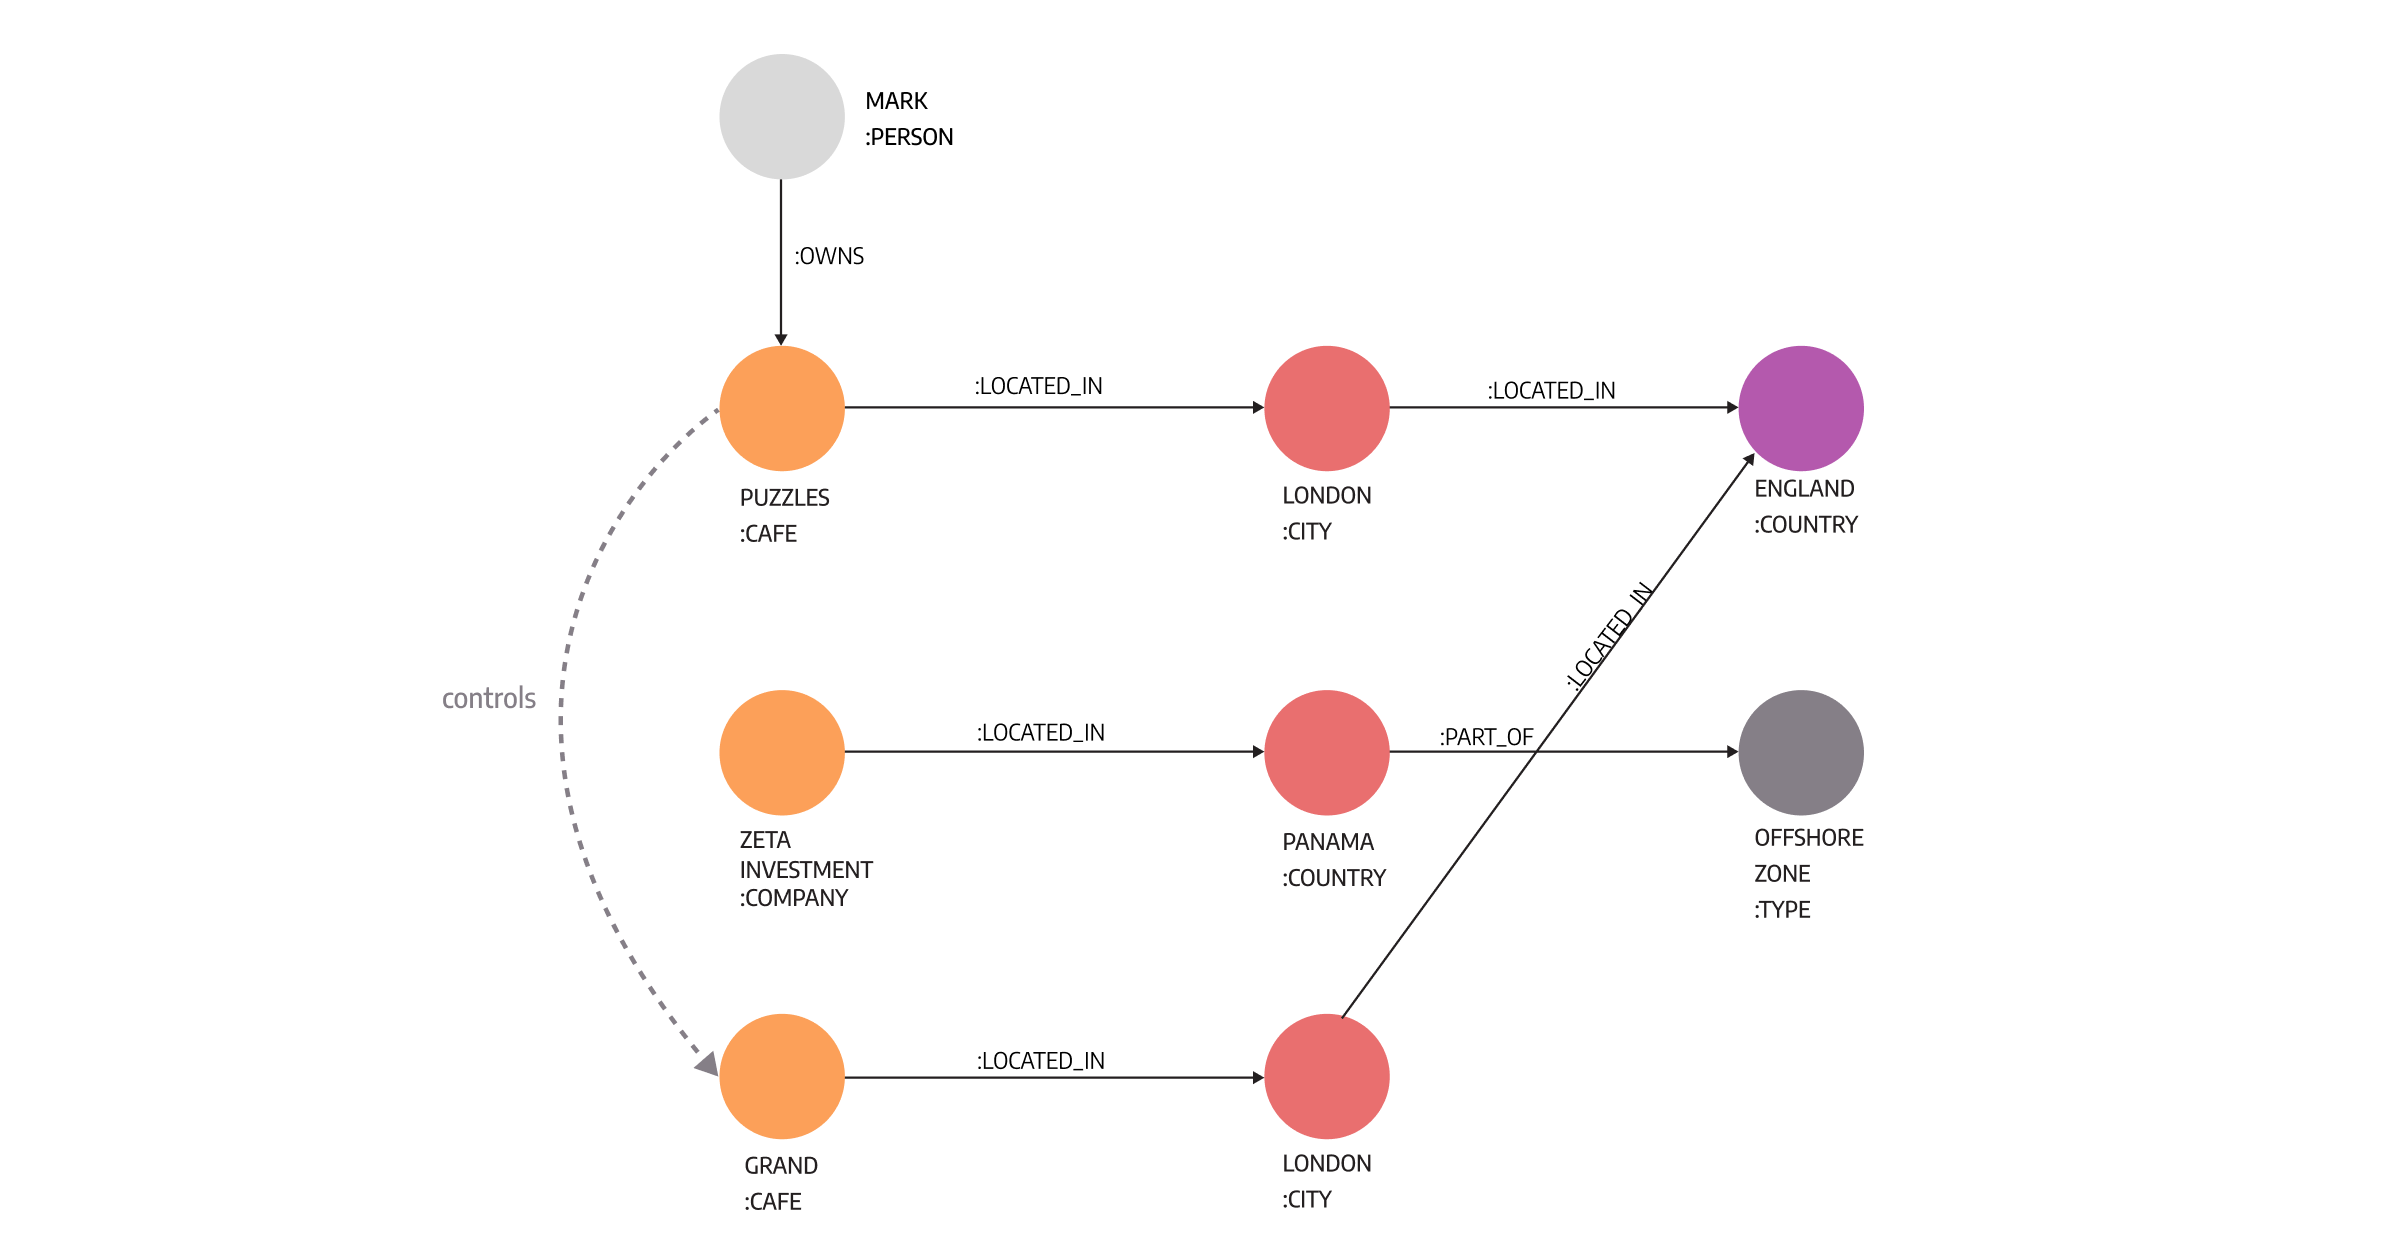
A typical knowledge graph, like the one in the image below, consists of information melded from different sources. Melding all the information creates a rich description of the main domain and describes the context without detailed explanations. The image below depicts cafe ownership, indicating suspicious and illegal actions because one company controls the other through an offshore region, often the first sign of illegal behavior.
When taking a closer look, a knowledge graph is essentially a set of nodes and relationships and, as with any other graph, it can be subjected to graph optimizations or operations such as traversals and transformations.
The expressivity and power of the knowledge graph stem from the formal semantics attached to those nodes and relationships. These semantics enable humans and machines to infer new information without introducing factual errors into the dataset.
The added formal semantics serves as an agreement between the developers of the knowledge graph and its users regarding the meaning of the data in it. A user could be another human being or a software application that wants to interpret the data in a reliable and precise way. Semantics ensure a shared understanding of the data and its meaning.
To summarize, a knowledge graph is a database, a network, and a knowledge base rolled into one. It's the same data acting in different roles:
- Database - data can be queried via structured queries,
- Graph - data can be analyzed as any other network data structure,
- Knowledge base - data bears formal semantics used for interpreting and inferring new facts.
Real issues companies face
As previously mentioned, the majority of the issues companies are facing stem from the fact that data is being kept isolated in data silos. Isolated data cannot provide any information or knowledge. These isolated data sources can be integrated using point-to-point data integration, but the process is costly and time-consuming.
What’s even worse, the process does not address the fundamental issue of reusability. Once you integrate two different sources, the product of such integration is difficult to integrate with another source. Seamlessly merging data is difficult and results in troublesome proprietary formats. Connecting data will never be as intuitive with relational databases as it will be with graph databases. With graph databases, it is possible to replicate connections in a way that is easier for humans to express and consume information.
Another fundamental issue companies are facing is the problem of a rigid schema. With business needs growing, customers and market changing and the overall face-paced dynamic of the real world, it seems far-fetched that companies will define exhaustive data schema a priori. With enough resources and time, it is possible. On the other hand, knowledge graphs are dynamic and allow for the schema to change and adapt depending on the situation.
Graph databases as solutions
When the data is highly-interconnected, and we are seeing that more and more across vertical sectors, those connections are just as much as actual data elements themselves.
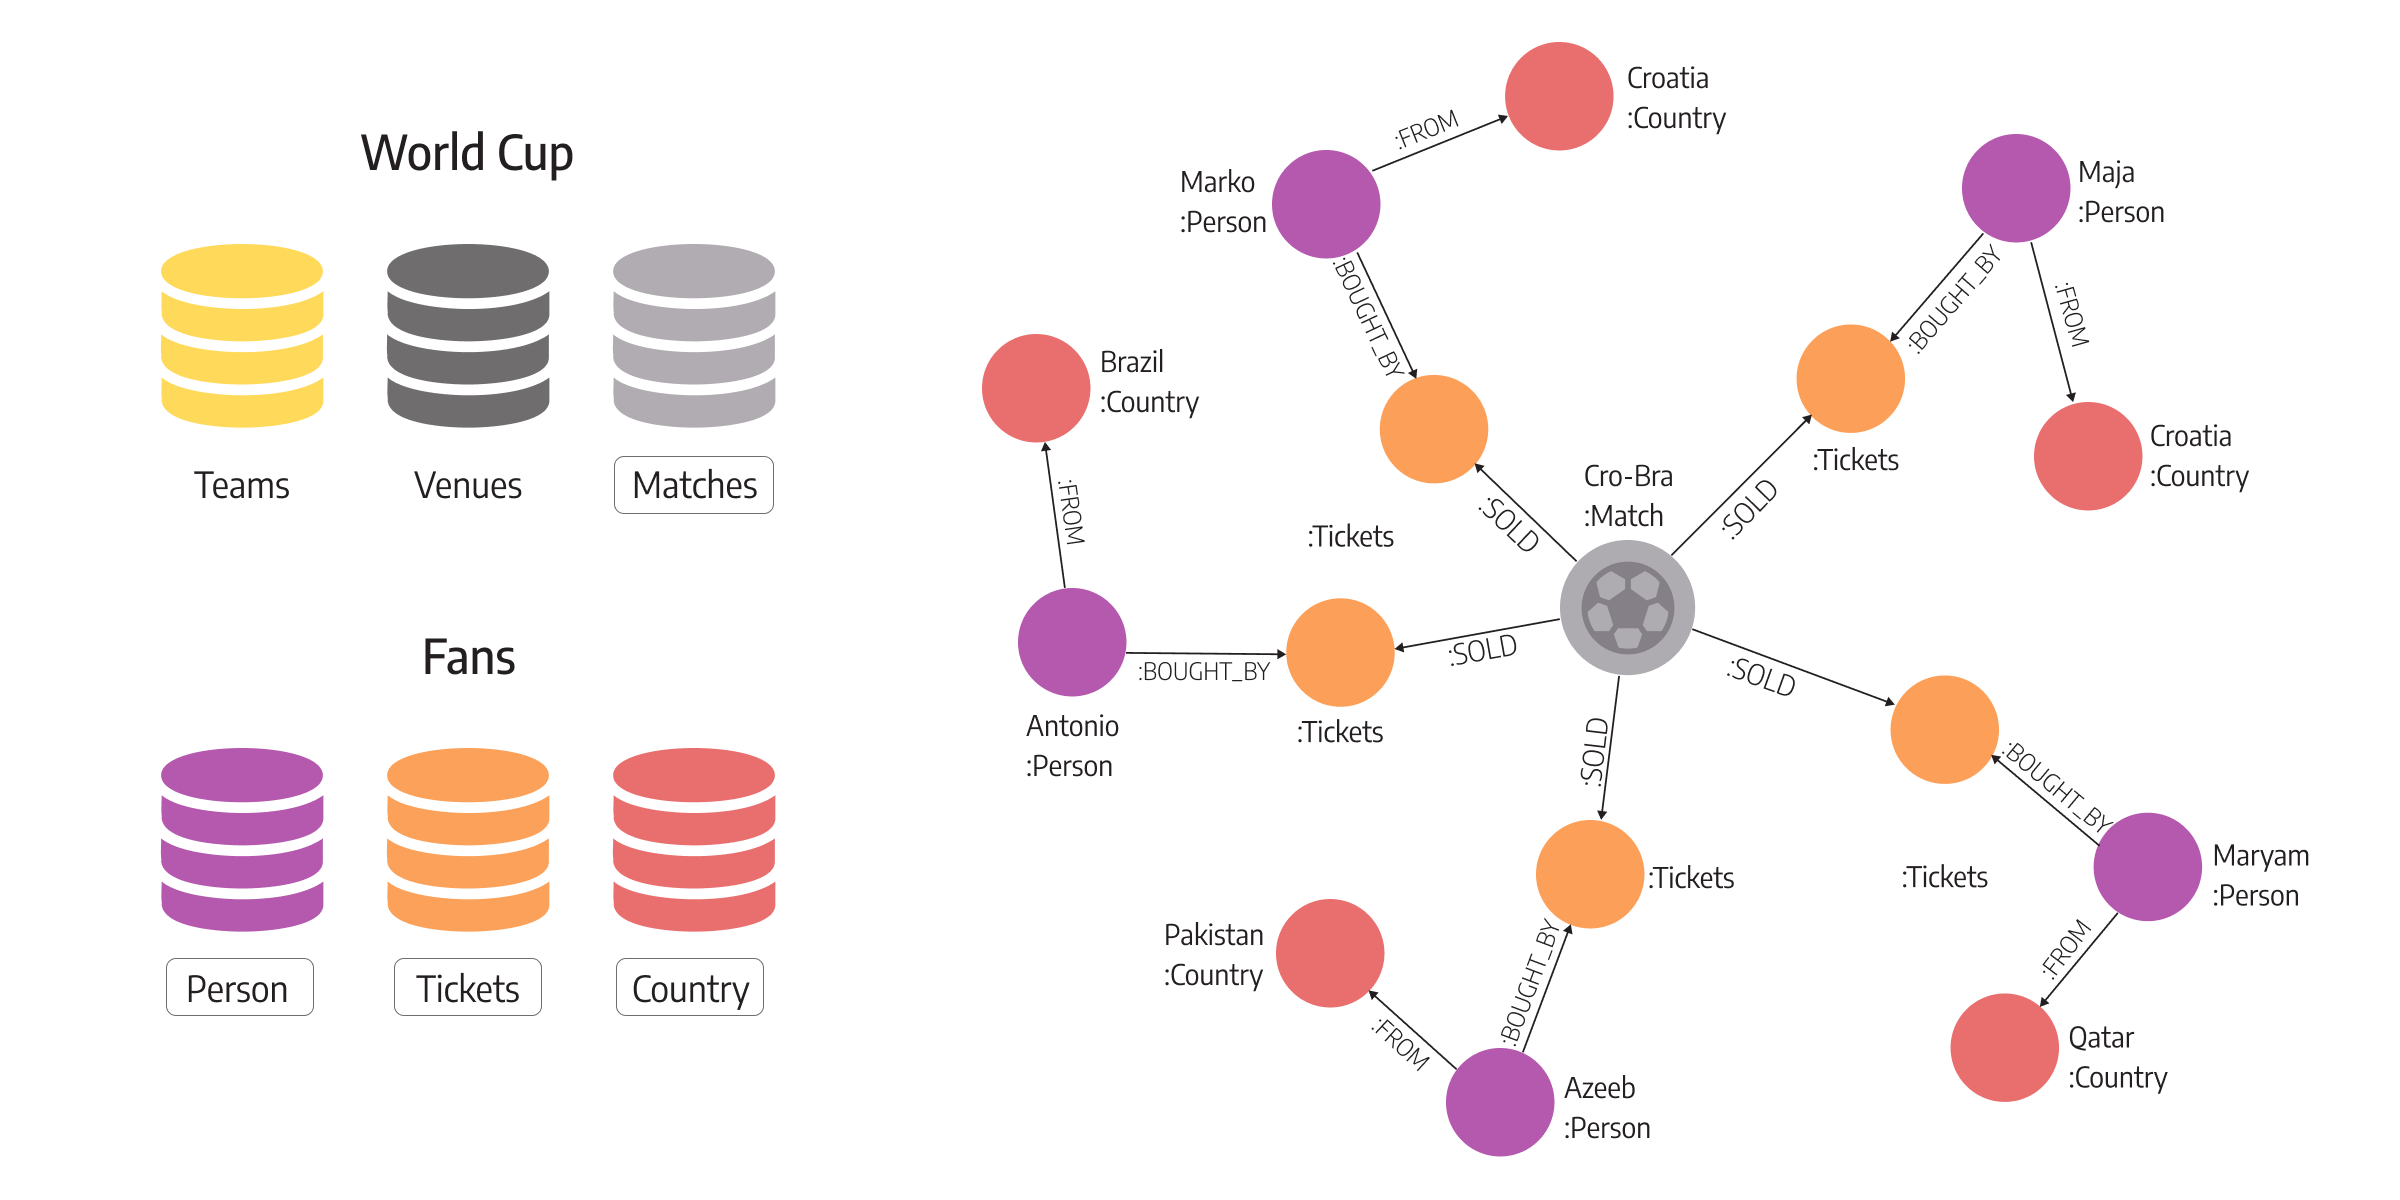
Let’s consider this example. The image below shows two different processes, one is about countries hosting World Cups, and the other is about the fans' journey during World Cup. Storing data points that are connected to different locations makes it difficult to complete the fans' stories about their experience of World Cups. For example, noticing which countries fans prefer depending on the number of tickets sold in the games played, and ticket prices make it easier to analyze the whole situation and the fans' journey proces.
Possible solutions
One possible solution is to put all that data into a data lake, data warehouse, or something similar and to use Hadoop or Elasticsearch to retrieve information. This would, of course, be a painfully slow retrieval because data is unstructured, and pinning entities and connecting them would take a long time.
The best solution is to take the data out of silos, materialize information as a graph, and meld the data from different sources into one large supergraph. Then various bits of information are stitched together to get a 360 view of this newly melded entity of interest, in the example above, products and customers. Once the data is no longer scattered and disconnected across different silos, it’s easier to explore it as well.
Highly interconnected data now represents a regular graph. The graph doesn’t yet provide any deep insights or generate intelligent behavior. But it provides companies with context, which is an important first step towards grabbing and making the best of those opportunities to innovate.
Further steps
The next step would be to add semantics on top of the data, which was integrated as a part of the graph. Adding a new layer on top of the data achieves two things. Firstly, an agreement is made between the developers of such a contextualized graph and the users about the meaning of data. Secondly, the top-layer view of data enables its interpretation.
For example, by adding classes such as User, Product, Review, and Negative review as a subcategory of Review category, it is further possible to infer new knowledge. Such process embeds semantics into graphs.
When a certain user returns an item made by different manufacturers, the user probably doesn’t enjoy the whole product category, and agents behind graph data can infer a new “negative” relationship between user and that item category, for example (:User {name: “Mark”})-[:DISLIKES {probability: “very likely”})-(:InEarHeadphones ). Such a relationship can be used further down the road to recommend different items.
Compatibility of problem and solution
Graph databases evolve by building relationships between entities and by searching for patterns that new knowledge has inferred. When data is highly interconnected, it’s important to consider all the relationships formed between nodes, and that’s easier to do with a graph database than S3 files stored in AWS, Elasticsearch, or even SQL tables. Even though those solutions are great for solving various problems by combining and connecting different data points, graph databases outperform them every single time.
It is important to remember that knowledge graphs have schemas because of the semantic layer on top of the data, which makes inferring new knowledge possible. One of the key reasons why graph databases are great for melding different data sources compared to relational databases is that the schema is dynamic. It doesn’t need to be defined a priori and is not subjected to unhelpful data normalization requirements.
It is also easier to enrich graph nodes and relationships with new data, especially in the case of labeled property graphs (LPG). Users usually leave text reviews that fall under some category and it is necessary to use NLP pipelines to classify what kind of review the user left. Once the information is found, new data can be added to nodes very easily.
This would be an issue in relational databases where there are fixed tables for every node type. Graph databases also save memory (and money) by not allocating space for information a node could probably never have.
In short, graph databases provide knowledge graphs with performance benefits because:
- Graph solutions focus on highly-connected data that comes with the intrinsic need for relationship analysis.
- Graph databases are optimized for data retrieval, often done by knowledge graphs.
- Graph databases are ideal for inconsistent data models that demand frequent changes because graph databases are more focused on the data itself rather than the schema structure.
Conclusion
Many companies have meticulously gathered data about everything, but now they don’t know how to use it to drive their business! Meaningless piles of data are stored in siloes or are managed using the wrong solutions, such as relational databases, with rigid schemas. In the end, companies have no idea what they know, nor what they don’t know about all the processes that go while they are conducting business. And lacking knowledge is a sure path to missing valuable opportunities. Graph databases help define dynamic and interconnectedly layered knowledge graphs enabling companies to make sense of their data and start generating solutions that will bring them closer to their goals.