Identifying Essential Proteins Using Betweenness Centrality & Memgraph MAGE
Proteins perform many functions within organisms, including DNA replication, providing structure to cells, and transporting molecules. Even though all proteins are important, essential proteins play a vital role, so their deletion could be lethal. Proteins are created in the organism according to instructions written in genes. Genes are small parts of the DNA, a sequence containing only four chemical units denoted as A, C, G, T.
In recent years, researchers have proved that essential proteins often have a correlation with disease genes. Therefore, the identification of essential proteins is the foundation for disease diagnosis and treatment. Drug design methods heavily rely on detecting essential proteins to find drug targets.
Experimental methods often used to discover essential proteins are expensive and time-consuming. In many real-world scenarios where these methods are not feasible, computational methods play a critical role.
This tutorial will describe and utilize betweenness centrality, one of the widely used methods for identifying essential proteins.
Protein-protein interaction network
Proteins rarely act individually; they are often in interaction with other proteins to perform some function. Protein-protein interaction networks (PPIN) are used to simplify and model these complex interactions. In PPIN, proteins are represented as nodes. Interactions between proteins are described by edges connecting the corresponding nodes.
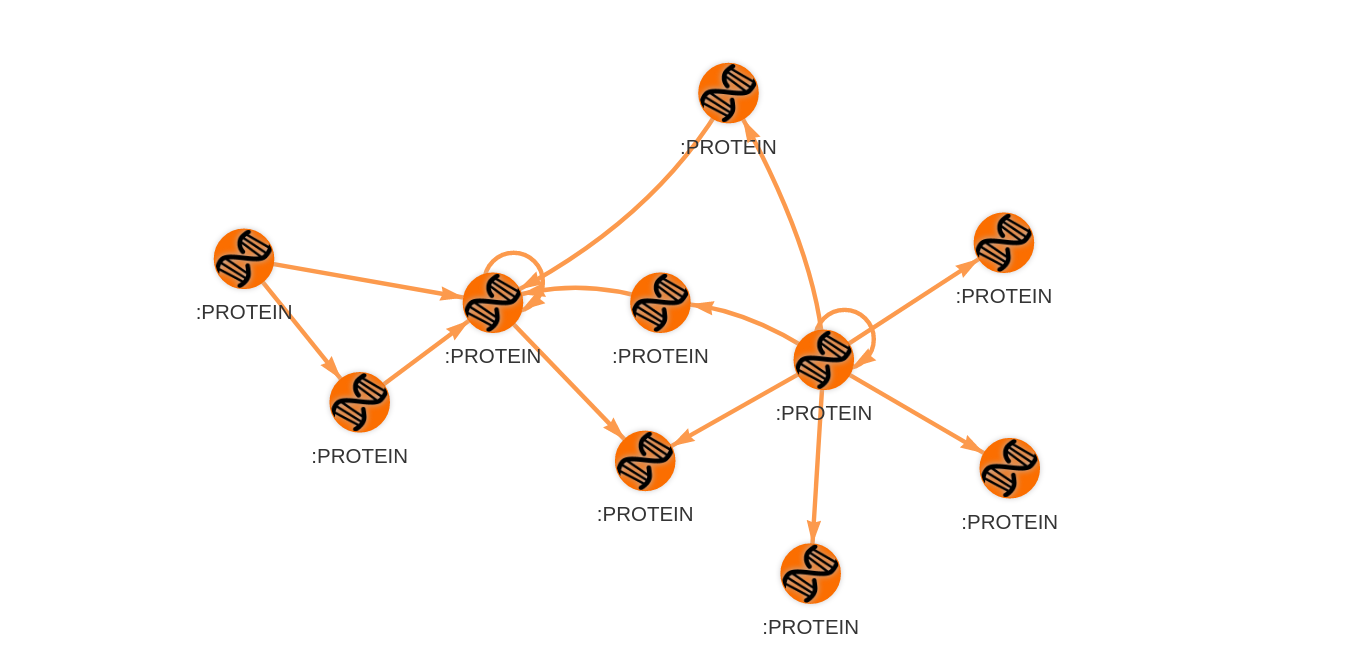
Researches have discovered an important property of PPINs and consequentially enabled us to develop methods for identifying essential proteins. Most proteins in PPINs interact with only several other proteins, meaning that they do not have many connections. However, there is a small number of proteins that interact with almost every other protein. These proteins, included in many interactions, can be detected in the network as highly connected nodes, called hubs. It turns out that hubs are the essential proteins we want to identify.
Betweenness Centrality
Centrality analysis provides information about the node's importance for an information flow or connectivity of the network. Centrality can be measured using different metrics, but we will focus on betweenness centrality since it is one of the most used.
Betweenness centrality measures the extent to which a node lies on paths between other nodes in the graph. Nodes with high betweenness may have considerable influence within a network under their control over information passing between others.
The calculation of betweenness centrality is not standardized, and there are many ways to solve it. It is defined as the number of shortest paths in the graph that passes through the node divided by the total number of shortest paths.
Using the MAGE Betweenness Centrality
Memgraph Advanced Graph Extensions (MAGE) is a versatile open-source library containing efficiently implemented standard graph algorithms that you can run as Cypher procedures. The project is started by Memgraph to encourage developers to share innovative and useful query modules so the whole community can benefit from them.
Betweenness centrality is one of the algorithms included in MAGE. The algorithm implementation is inspired by Brandes algorithm.
Prerequisites
To complete this tutorial, you will need:
- An installation of Memgraph Advanced Graph Extensions (MAGE). Follow the installation instructions on the Installation page to get started.
- An installation of Memgraph Lab: an integrated development environment used to import data, develop, debug and profile database queries and visualize query results.
Building Your Graph Data Model
The data set we will use in this tutorial is created based on a Tissue-specific protein-protein interaction network [1]. This dataset contains a large number of protein-protein interaction networks, specific for various human tissues.
Nodes, represented with Entrez gene IDs, are human proteins. Entrez Gene is the gene-specific database at the National Center for Biotechnology Information (NCBI). Entrez Gene ID is the unique identifier for a gene representing the instructions for creating a particular protein. Feel free to consult the NCBI for detailed information about specific genes.
For this tutorial, we have expanded the existing data set with additional information scraped from NCBI so you can easily explore the protein networks. Therefore, each node has these properties: EntrezGeneID, OfficialSymbol, OfficialFullName, and Summary.
Edges represent tissue-specific physical interactions between proteins. There are no additional properties for an edge.
Two files are available for each tissue, one containing descriptions of the protein in the selected tissue, the other listing all protein interactions.
You can download the tissue-specific data used in this tutorial from here.
Importing the dataset
The LOAD CSV clause enables you to load and use data from a CSV file of your choosing within a query.
Firstly, you should load information about nodes.
LOAD CSV FROM "properties_addres.csv"
WITH HEADER DELIMITER "|" AS row
CREATE (n:PROTEIN
    {EntrezGeneID: ToInteger(row.EntrezGeneID),
    OfficialSymbol: row.OfficialSymbol,
    OfficialFullName: row.OfficialFullName,
    Summary: row.Summary}
    );
Secondly, create a database index for faster processing.
CREATE INDEX ON :PROTEIN(EntrezGeneID);And finally, import interactions!
LOAD CSV FROM "interactions_addres.csv"
WITH HEADER DELIMITER "|" AS row
MATCH (a:PROTEIN {EntrezGeneID: toInteger(row.EntrezGeneID1)}),
(b:PROTEIN {EntrezGeneID: toInteger(row.EntrezGeneID2)})
CREATE (a)-[e:INTERACTION]->(b);
Identifying Essential Proteins with Betweenness Centrality
In this section, we will show how to utilize the Betweenness Centrality procedure in Memgraph MAGE for the essential proteins identification task. Also, we will analyze the obtained results to find out how this simple approach to solving the described problem works.
First, by running the following Cypher query, you will call the Betweenness centrality algorithm and store the results in properties of corresponding nodes.
CALL betweenness_centrality.get(FALSE, TRUE)
YIELD node, betweeenness_centrality
SET node.BetweennessCentrality = toFloat(betweeenness_centrality);
Now that we have calculated the betweenness centrality score for all the proteins in the tissue we had loaded, we can easily find the most important ones according to this centrality measure. Just copy the following query that sorts the proteins according to the betweenness centrality property in descending order.
MATCH (node:PROTEIN)
RETURN node
ORDER BY node.BetweennessCentrality DESC;
You should end up with results similar to those shown below, depending on the tissue you have chosen.
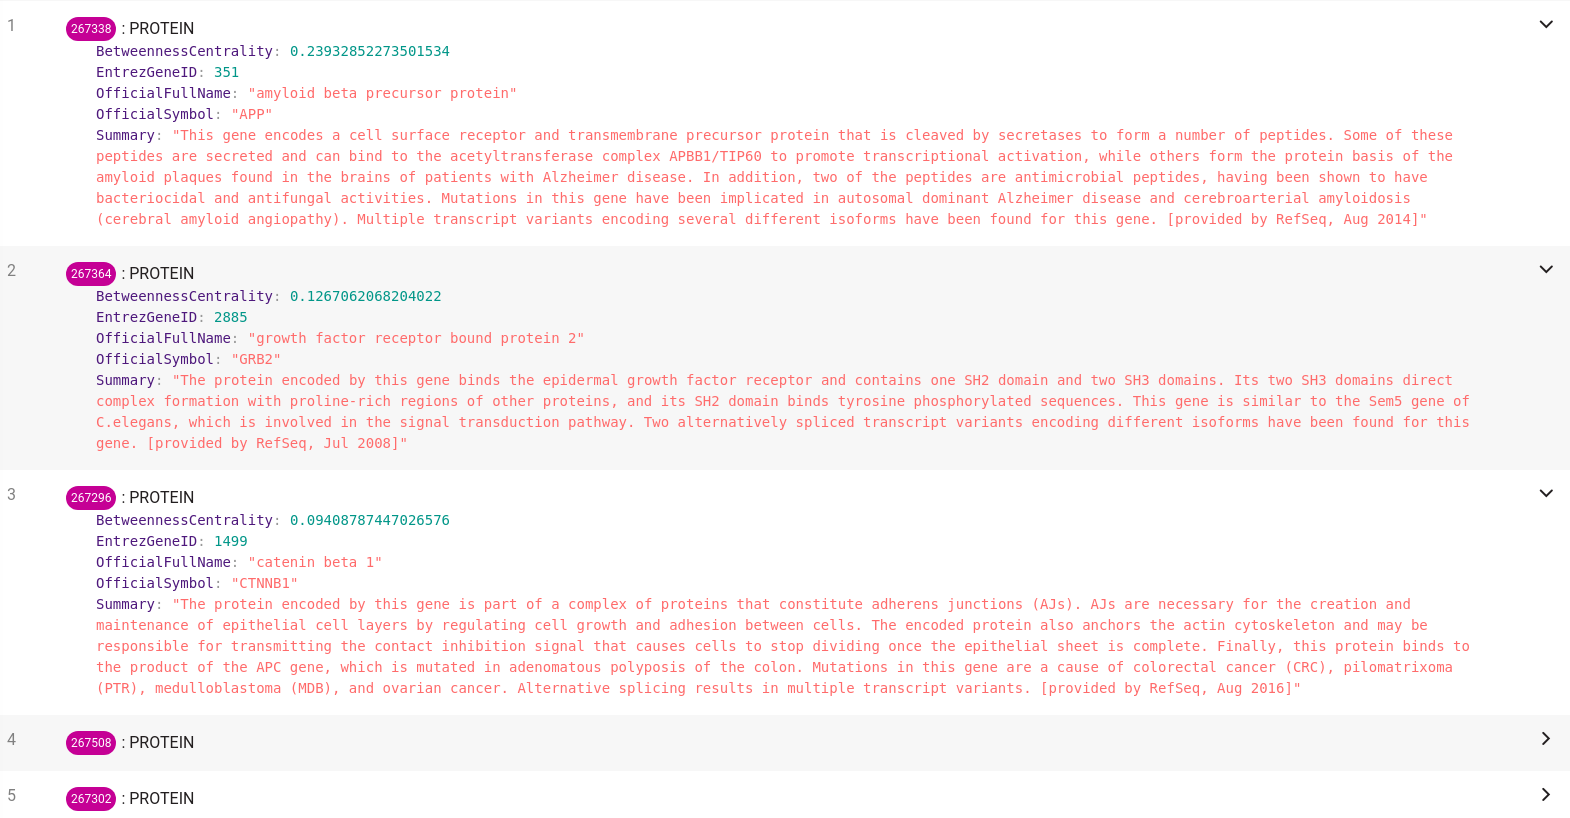
We can observe that the essential protein in the Cochlea is APP. This protein is associated with Alzheimer's disease, which somewhat confirms the assumption that essential proteins are disease-related.
Visualizing Your Results
You can run the protein explorer web application to explore the tissue-specific protein networks in more detail visually. You can find the source code in our GitHub repository. Just follow the simple installation instructions, and you should end up with a simple yet powerful tool for analyzing protein interactions in human tissues.
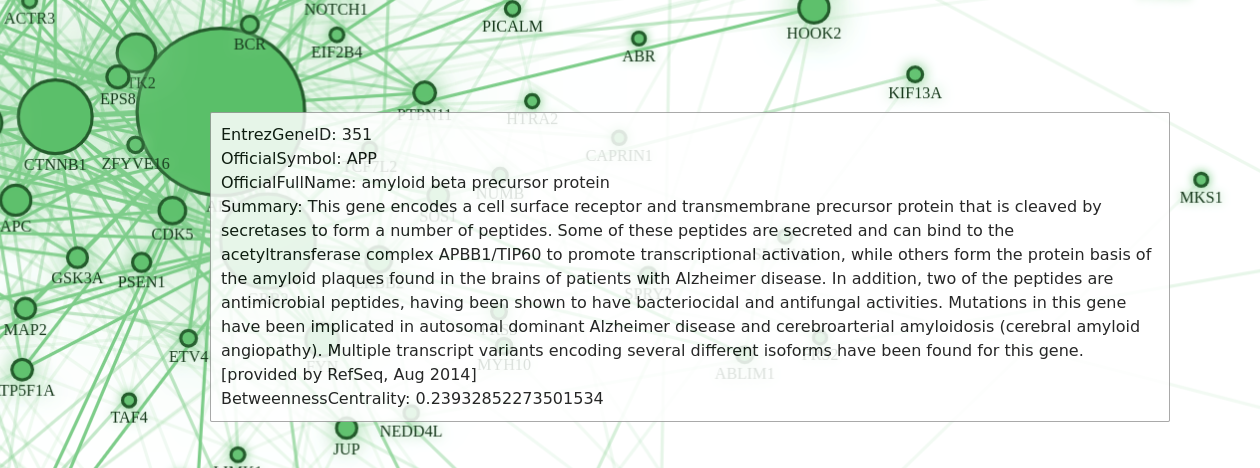
After starting the application, you can easily choose the human tissue you want to analyze. Before displaying the network, the Betweenness Centrality algorithm is executed on the selected network. We have decided that the size of a node depends on the calculated betweenness centrality score of the protein represented by that node so that you can quickly locate the essential proteins in the whole network.
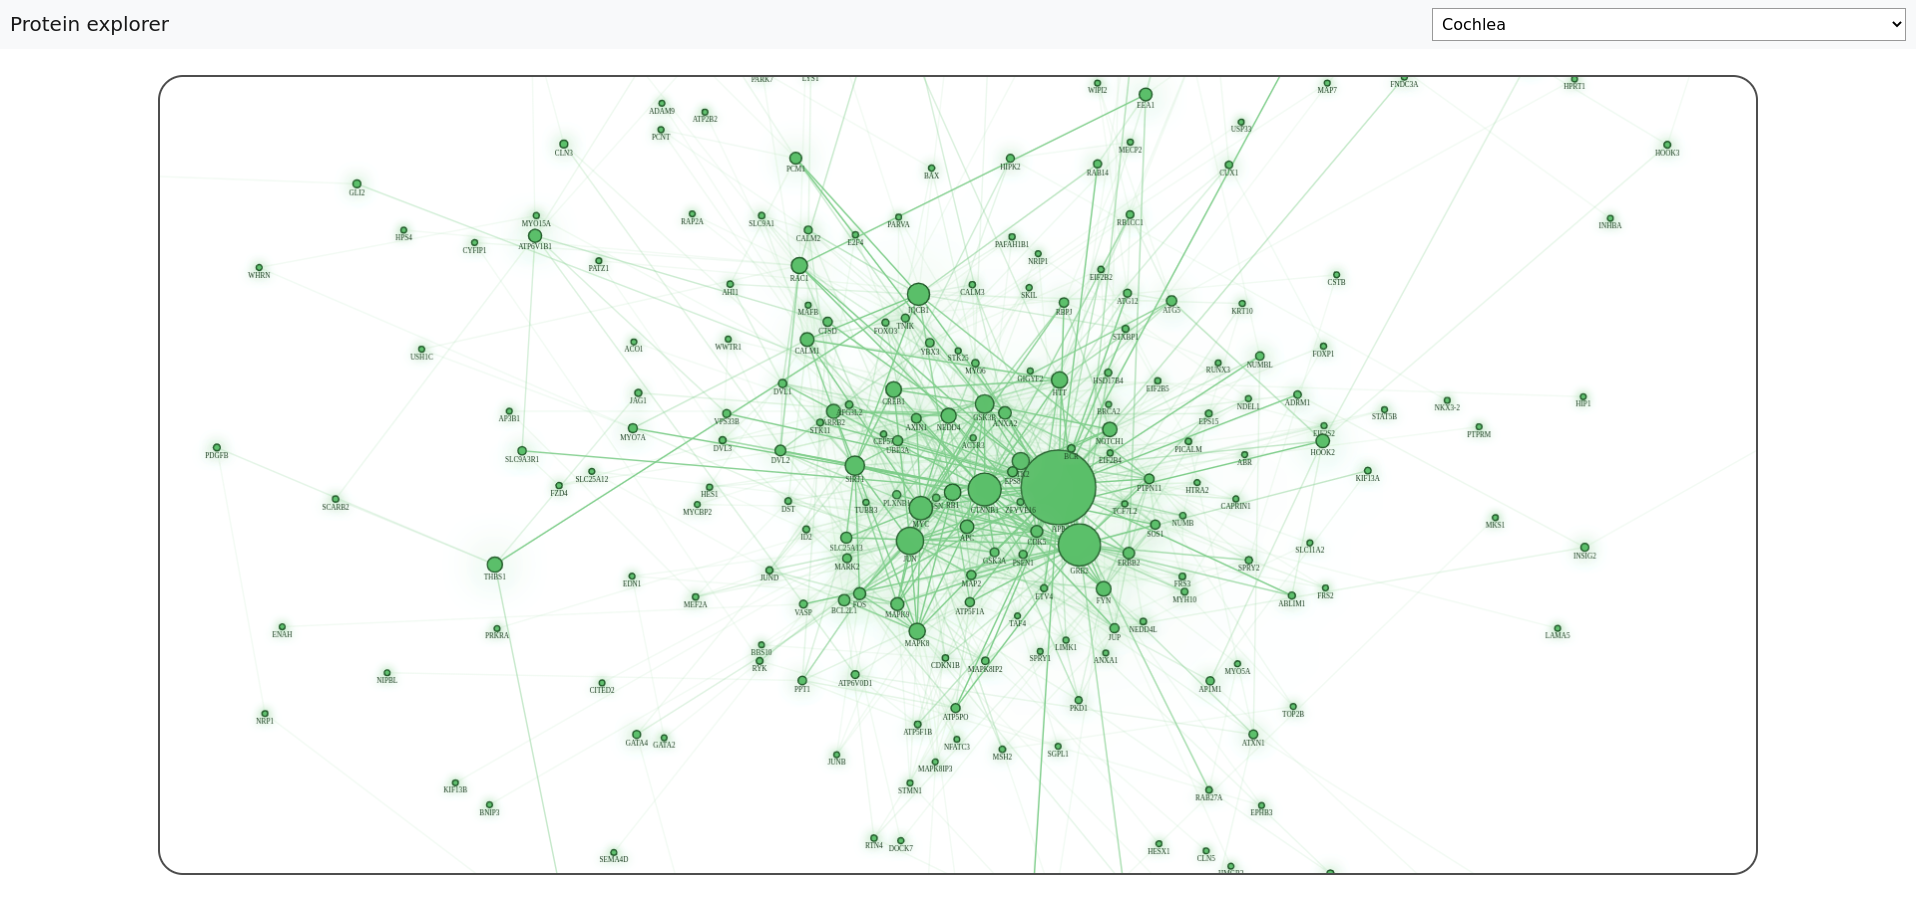
Although the official protein symbol is displayed with each node, sometimes it is just not enough information. You can get even more interesting details if you select the node representing the protein you are interested in.
Conclusion - Network Analysis is Crucial in Biology!
Understanding biological individuals in interaction with other biological identities become crucial on every level in modern biology, from the molecular to the ecosystem level. With the data explosion that has followed biological research in the last century, systematic and efficient approaches to data analysis have become imperative. Tools derived from graph theory have found a perfect fit in serving these interconnected and complex demands.
MAGE is a versatile open-source library containing standard graph algorithms that can help you analyze biological networks. While many graph libraries out there are great to perform graph computations, using MAGE and Memgraph provides you with additional benefits like persistent data storage and many other graph analytics capabilities.
If you found this tutorial beneficial, you should try out the other algorithms included in the MAGE library.
Finally, if you are working on your query module and would like to share it with other developers, take a look at the contributing guidelines. We would be more than happy to provide feedback and add the module to the MAGE repository.
References:
[1]: Marinka Zitnik, & Jure Leskovec. (2018). BioSNAP Datasets: Stanford Biomedical Network Dataset Collection. http://snap.stanford.edu/biodata.