BitClout - Who Are Content Creators Supported By? (Visualizing HODLers)
Introduction --- A word about BitClout
BitClout is a new type of a social network that lets you speculate on (the worth of) people and posts with real money. It's built from the ground up as its own custom blockchain. Its architecture is similar to Bitcoin's, except it supports complex social network models like posts, profiles, follows, speculation features, and much more at a significantly higher throughput and scale. Like Bitcoin, BitClout is a fully open-source project and there is no company behind it --- it's just coins and code.
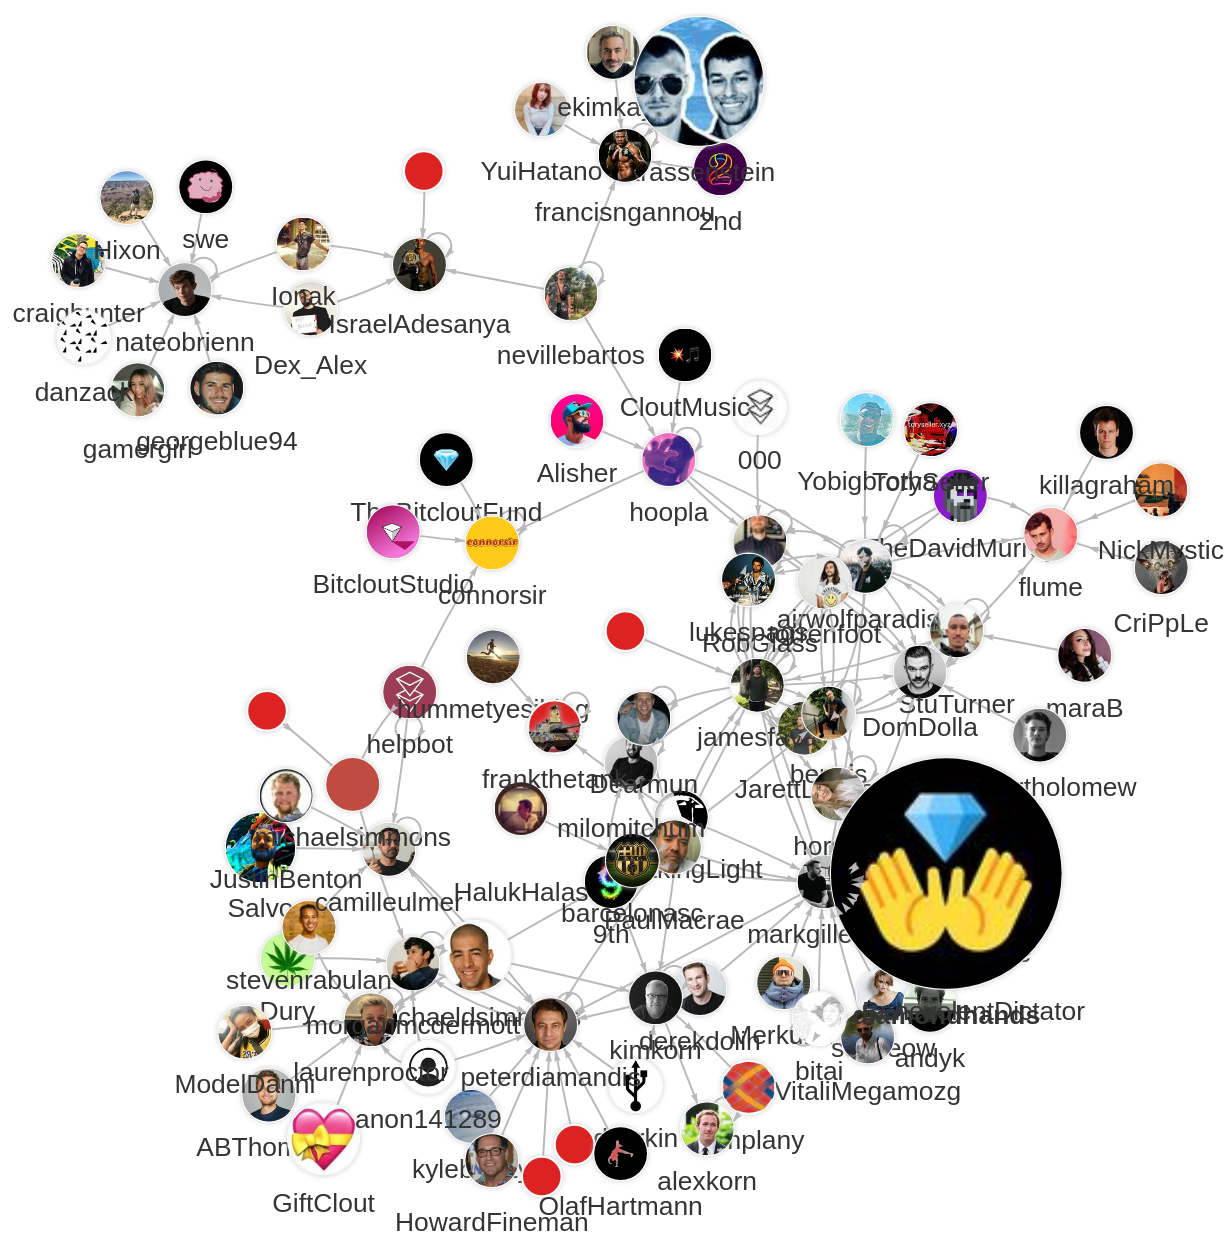
Since it's creation in March of 2021, thousands of investors swarmed the platform with millions of dollars. Looking to invest ourselves, we were interested which content creator coins were most likely going to increase in value. To do this, we have to observe a very important fact about BitClout. BitClout is a social network revolving around content creators and their supporters, HODLers, people who hodl (hold) their coins. The more hodlers a content creator has the more their coin is worth. We can model the BitClout community as a graph where nodes are represented by content creators and investors, and edges by connections between them. If we can predict which new connections are going to form we can generate a profit by buying the coins of undervalued content creators and selling them once they increase in value.
Being a company that values the power of graphs two algorithms immediately sprung to our mind. Google's PageRank algorithm, which ranks nodes in a graph by the value of their connections, and the Louvain method for community detection featured in the image on the beginning of this article. The community detection algorithm tells us which audiences stick together in the BitClout community. Based on this, if connections start forming to a new content creator from the majority of the community we can conclude the rest is probably going to follow.
Ranking content creators using PageRank
Here we have the top 10 users ranked by PageRank. PageRank favors quantity over quality when it comes to connections. That is why, BeActive is ranked higher than elonmusk, even though elonmusk's coin is worth more (at the time of writting).
| index | username | rank | | :---: | :-----------: | :------------------: | -------------------- | | 1 | BeActive | 0.06534831469247263 | | 2 | Cloutrex | 0.02877110638112634 | | 3 | Taylor Richey | 0.018742750007415286 | | 4 | elonmusk | 0.011899533689265654 | | 5 | JAb3dZ | nightcoremtb | 0.010067757879769686 | | 6 | cloutfeed | 0.00759060317028377 | | 7 | Davidsun | 0.006058864365693246 | | 8 | jakeclark | 0.005341668427896169 | | 9 | Angelad | 0.005272945921252985 | | 10 | iActive | 0.004981355396576359 |
How to get BitClout HODLers?
All the code used to create this demo can be found here.
Since the BitClout HODLers API isn't documented yet, we had to jump through hoops to acquire the data.
If you want to skip that part you can download the datasets we managed to extract here.
Jumping into Google Chrome's developer console when viewing the account of a content creator, under the Creator Coin tab, we noticed a call to the /api/v0/get-hodlers-for-public-key route.
Copying all the headers to python, we cobbled together a parallelised python script to go over every account in BitClout and get their hodlers.
After scraping the data, we slid it into Memgraph, a graph analytics platform. We did this for 2 reasons. One; python's networkx library was too slow, and two; we wanted to see changes whenever new connections are made in the network. To do that we needed to transform the scraped data into a CSV, and load it with a cypher script.
Thereafter it was smooth sailing. Or so we had thought. Analysing the data was a piece of cake. But presenting it, not so much. This is why we decided to split into three teams and tried to visualize the data using three different mediums: MemgraphLab, D3.js, and ObservableHQ. Feel free to explore the code for the visualization that looks most enticing!
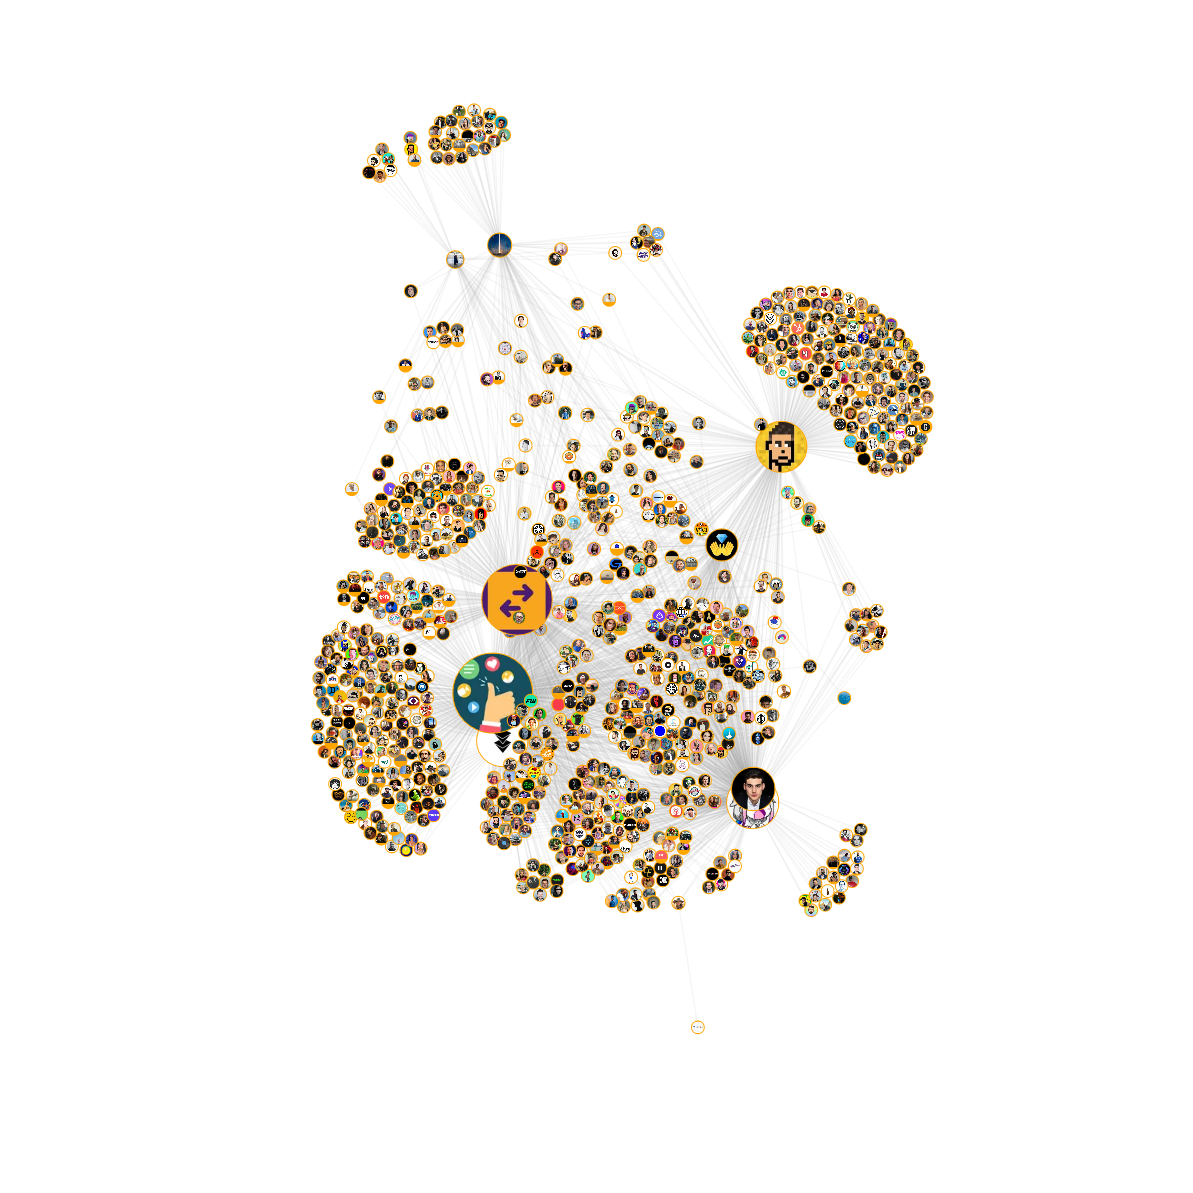 ObservableHQ visualization
 D3.js landing page visualization
 Memgraph Lab visualization