Graph modeling
In this tutorial, you will learn the basic terminology and practices related to graph databases and graph modeling.
What is a graph database?
A graph database is a type of database that stores data in the form of nodes that can be connected with relationships.
A graph database uses mathematical graph structures to represent and store data. Graph databases are designed to treat the relationships between data as equally important as the data itself. Those relationships allow stored data to be linked together directly and, in many cases, retrieved with one operation.
Where are graph databases used?
Graph databases have a wide range of functionalities and, therefore, a numerous variety of possible use cases. They offer agility, scalability, and performance for managing vast amounts of dynamic and growing data.
Some of the most relevant use cases include:
- Social Networks Graphs - The most common use case for a graph database, typical for relationship analysis between the users, community detection, or finding the influence of people in the network.
- Fraud Detection - The scalability and agility of graph databases help avoid heavy and slow queries, which are causing the late detection of frauds.
- Network Analysis - Network management revolves around complex interdependencies and high connectivity.
- Graph Theory - Graph databases are built on the principles of graph theory and, as such, can be used to showcase and solve common problems in the area.
- Recommendations Systems - Real-time, sophisticated recommendation engines to personalize products, content, and services.
- Data Management - A way to manage “data silos”, keeping track of data and its usage.
- Telecommunications - Telecommunications are all about connections between users, network components, devices, etc. which makes them suitable for graph modeling.
- Supply Chain Management - Optimization of product flow, uncover vulnerabilities and boost the overall resilience of the supply chain.
Graph components
Graphs are essentially very simple structures that map relations between objects. These objects are nodes and the connections between them are relationships. Keep in mind that there are other terms for nodes and relationships:
- node == vertex == point
- relationship == edge == link
People often use the terms graph and tree interchangeably, but graphs are a superset of trees. Graphs, for example, can have cycles while trees can't. A cycle means that there is a path through the data that leads back to the starting data point.
To fully utilize the power of graphs, you first need to get a basic understanding of the underlying concepts in graph theory.
There are four components a graph can consist of: nodes, relationships, labels, and properties. While only nodes and relationships are fundamental components that need to be utilized, labels and properties are often included as well because of the added functionalities they offer.
Nodes
Nodes often represent entities in the graph. They hold specific data in the form of properties represented as key-value pairs. To assign a role to each node, nodes can be tagged with labels. When working with the model domain, nodes can be easily identified by searching for nouns that represent entities with a unique conceptual identity.
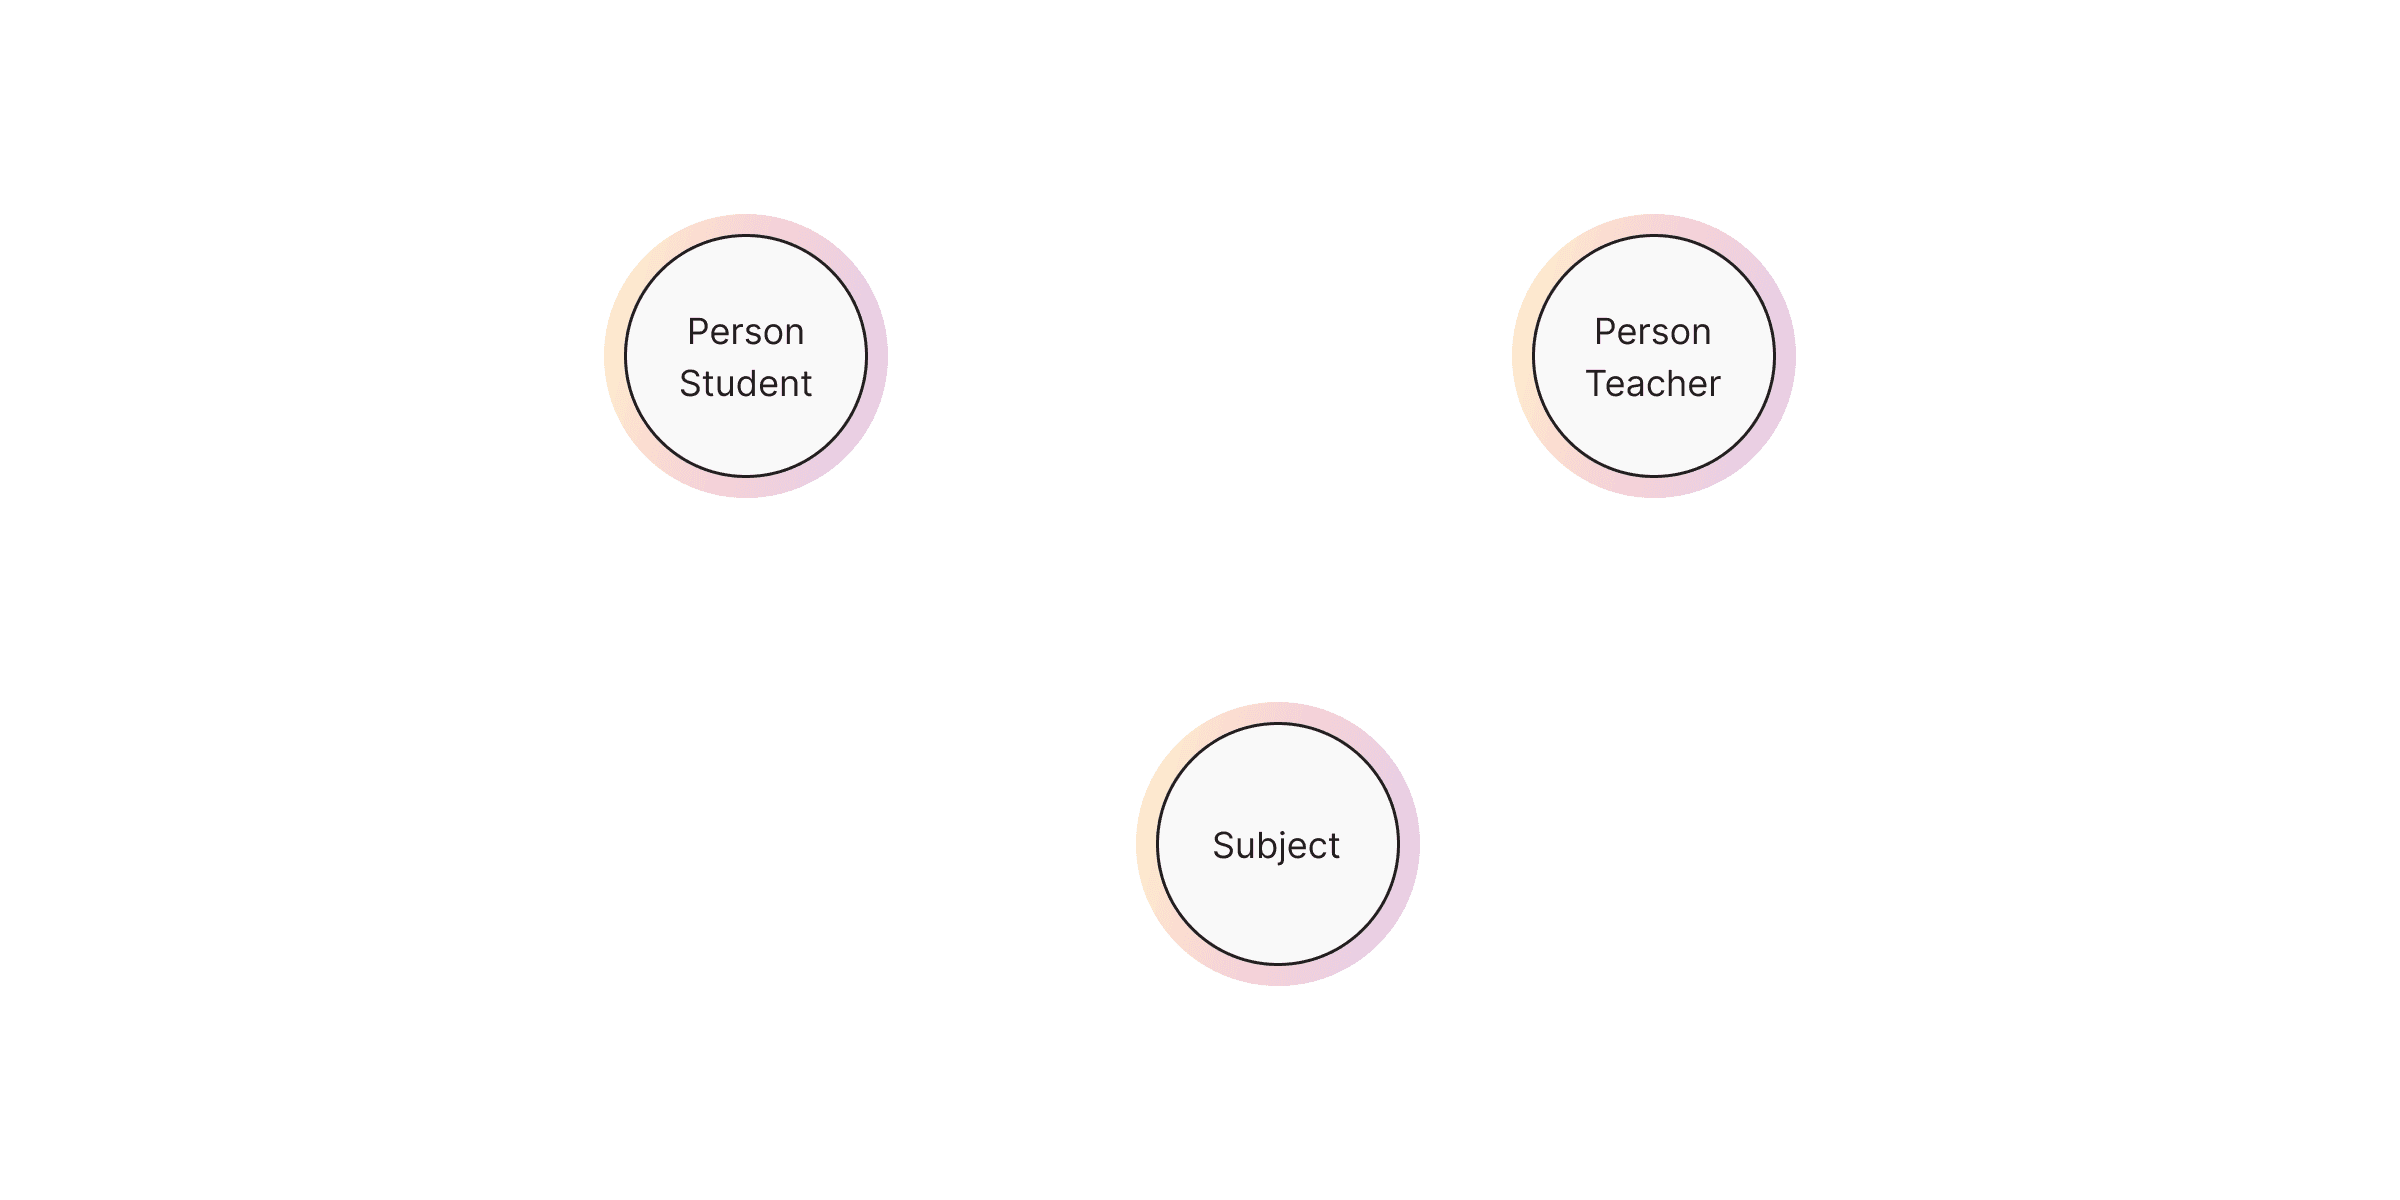
As you can see in the example further down, in the university model, a typical node could represent a university student, a professor, or a course.
Relationships
Relationships (or edges) are the lines that connect nodes to each other and represent a defined connection between them. Every relationship has a source node and a target node that represent in which direction the relationship works. If this direction is important, the relationship is considered directed while otherwise, it's undirected. Relationships can also store data in the form of properties, just as nodes. In most cases, relationships store quantitative properties such as weights, costs, distances, ratings, etc.
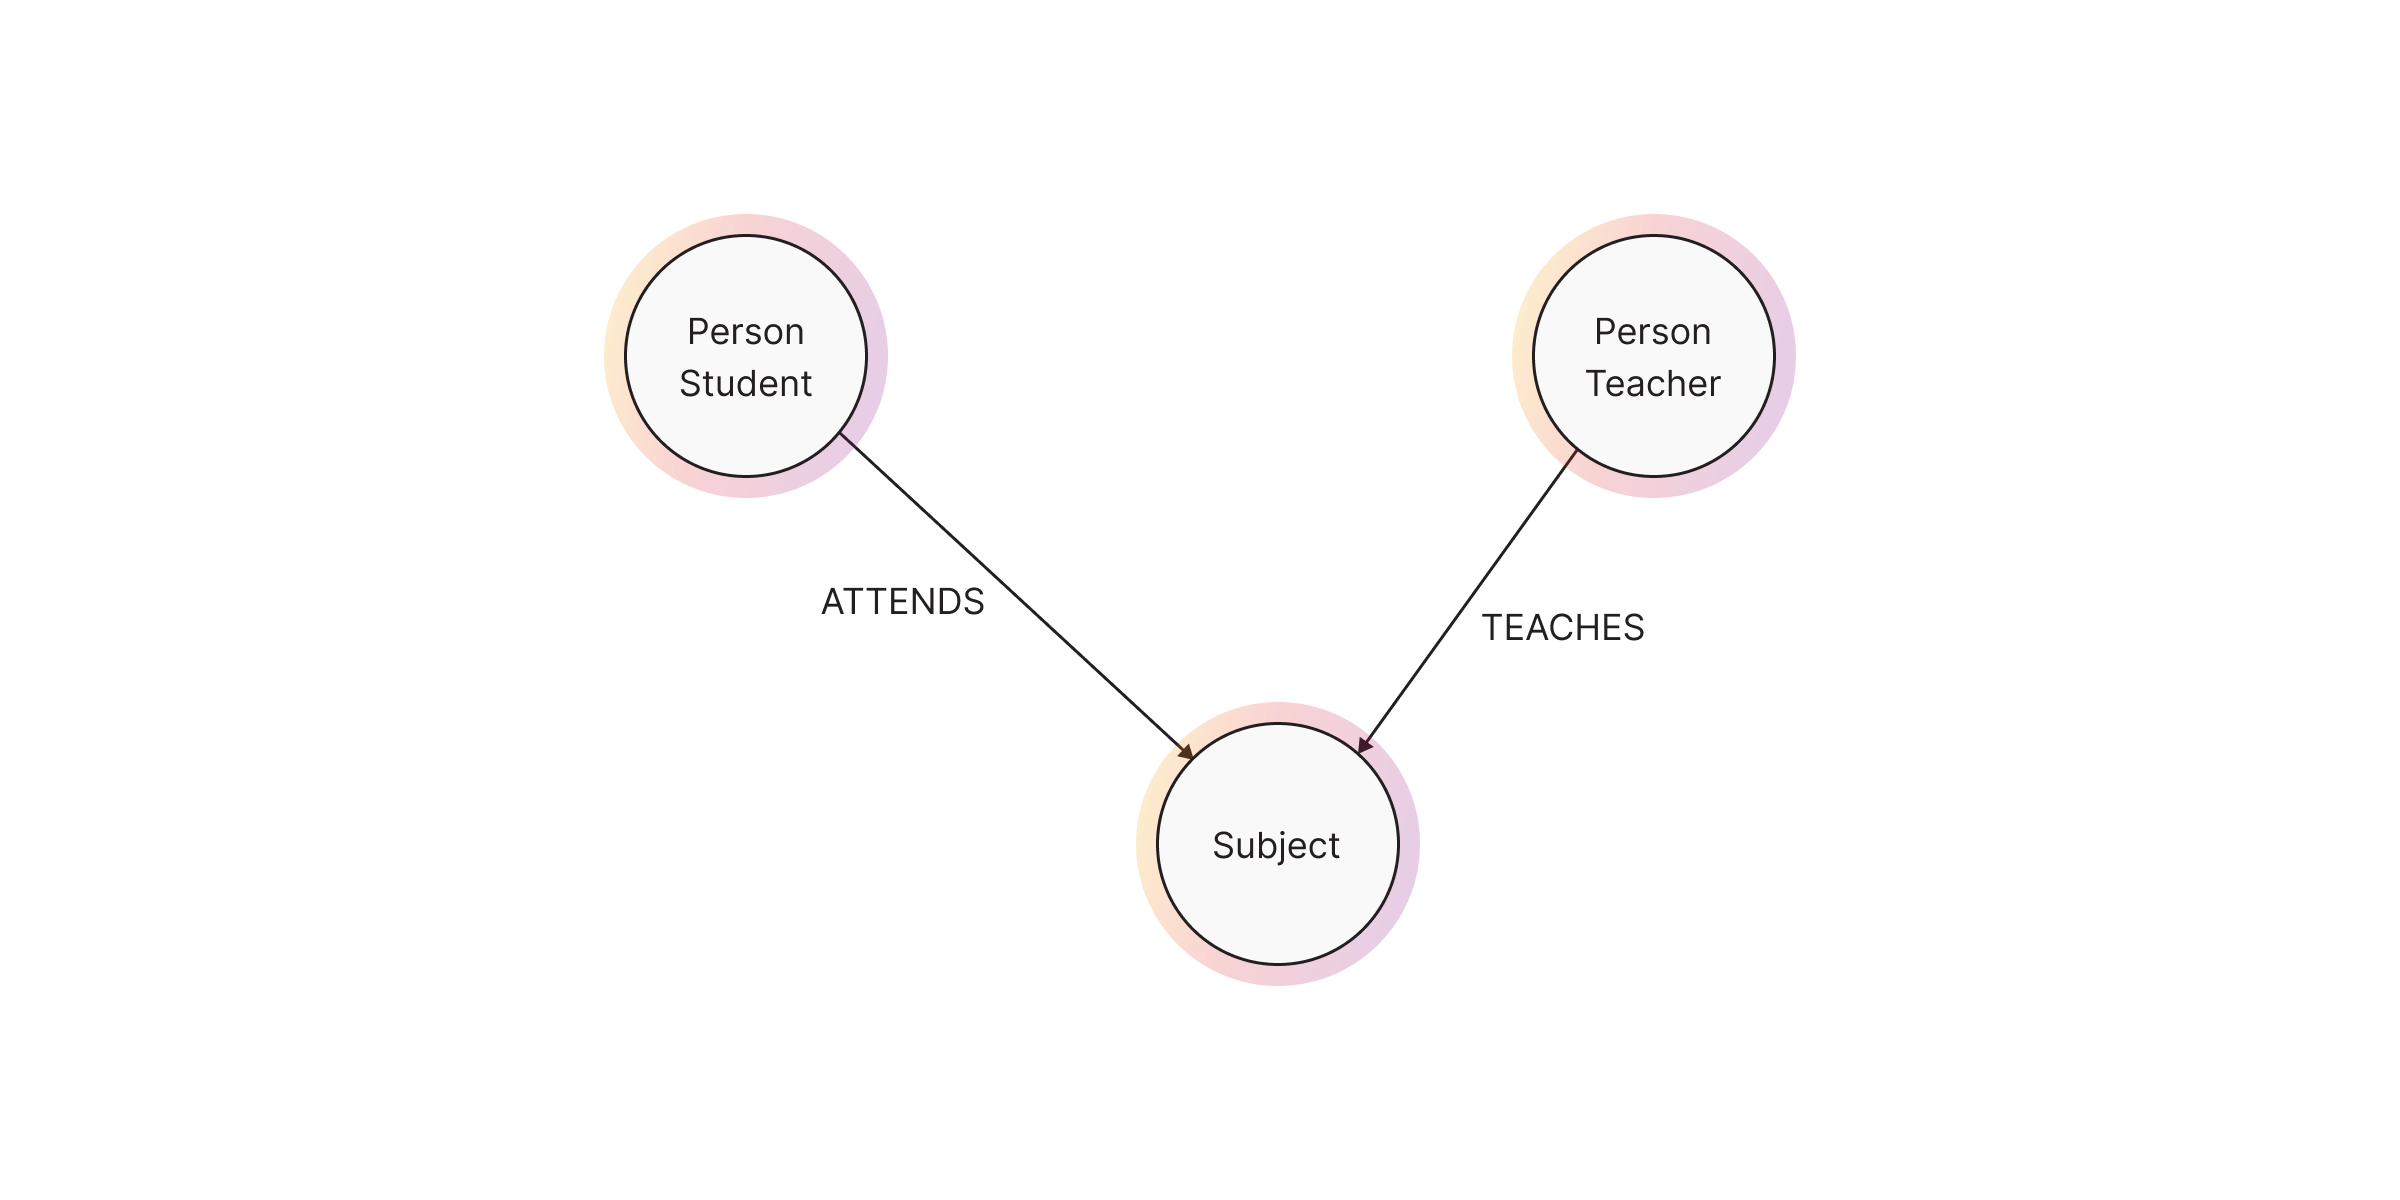
In our example, the relationship between a Student node and a Subject node
could be of the type ATTENDS, while the relationship between Professor and
Subject is represented by the type TEACHES.
Labels
Labels are used to shape the domain by grouping nodes into sets or categories. Nodes with the same label belong to the same set. This way of grouping nodes together simplifies database operations significantly. We no longer need to select the whole graph but only the set of nodes we are interested in. Nodes can also have multiple labels attached to them. Just as nodes can be easily identified as nouns in the domain description, you can identify labels by generic nouns or groups of people, places, or things.
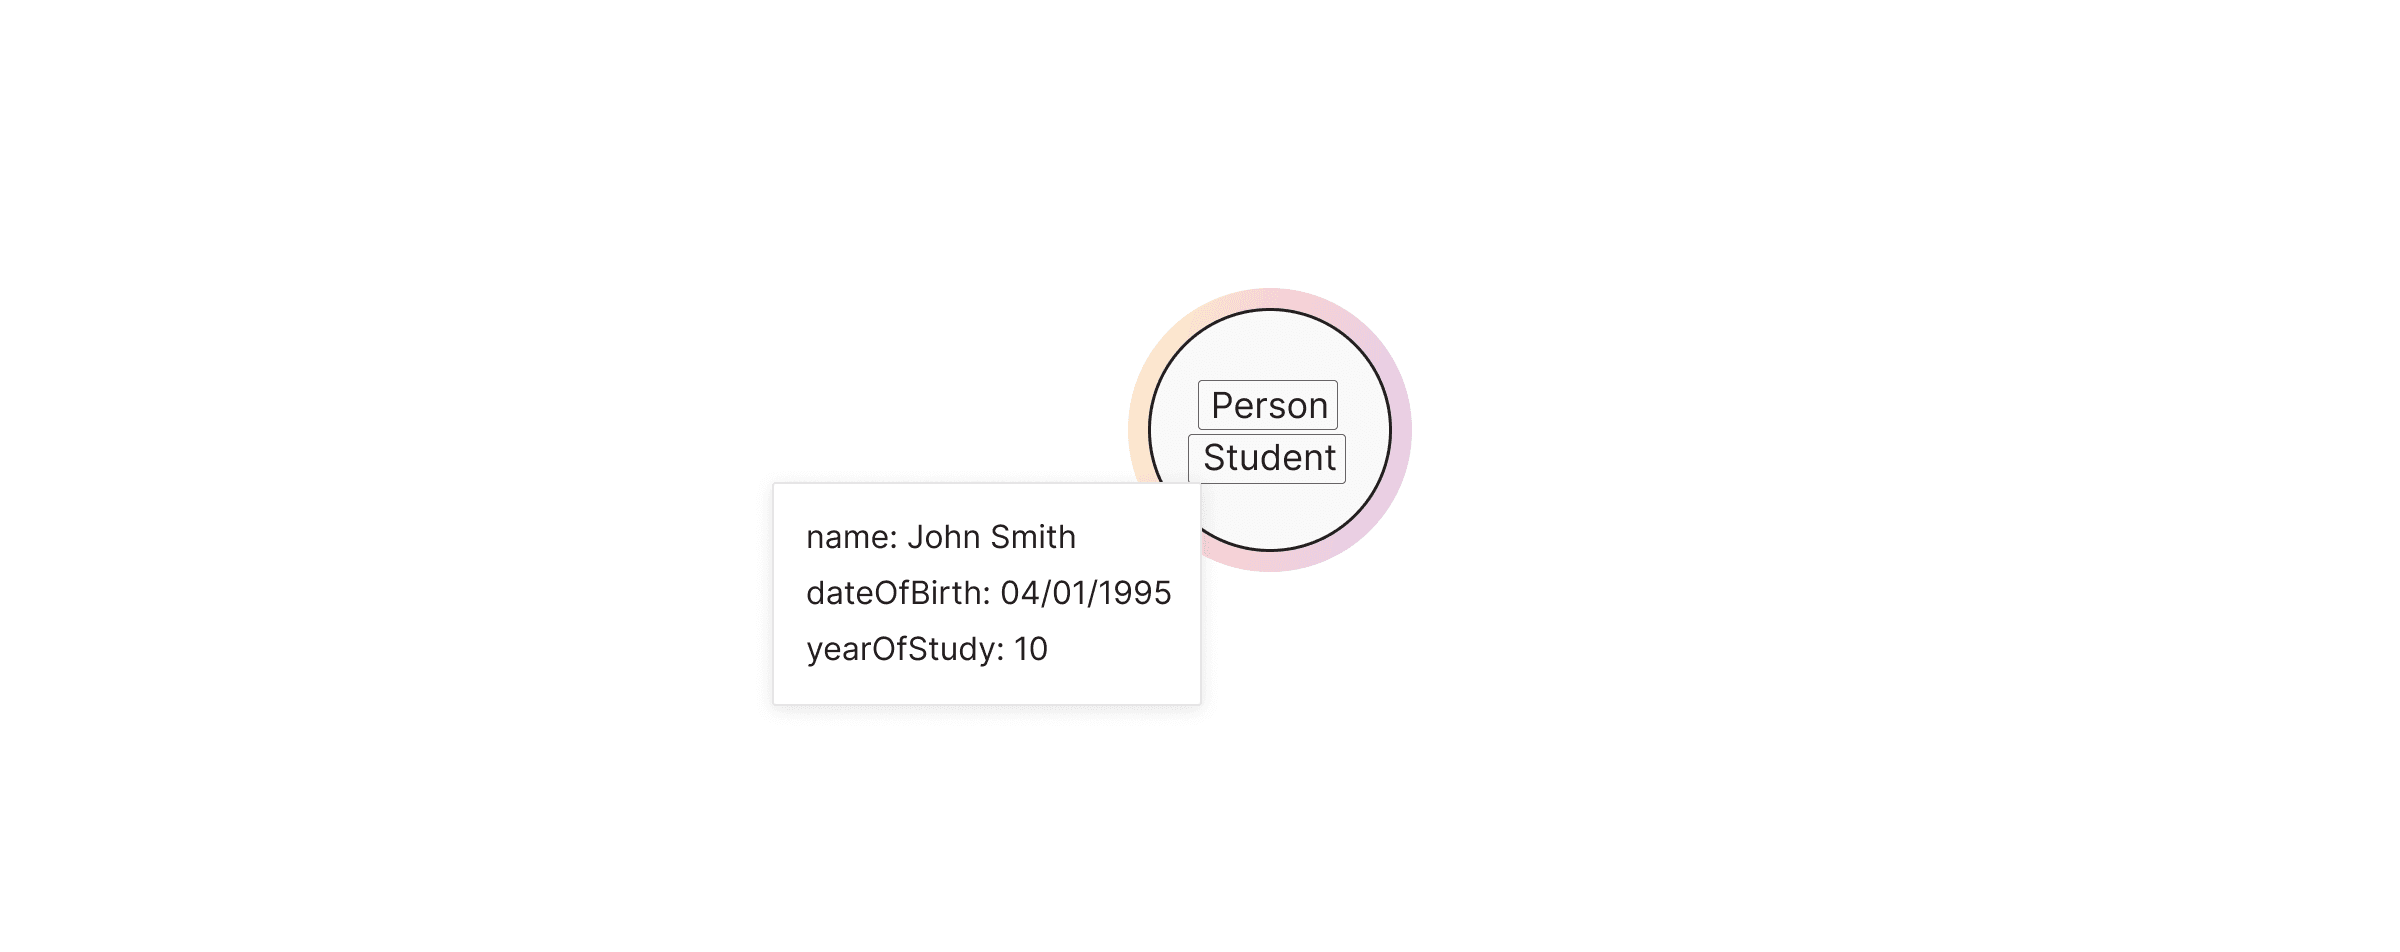
The node in the example below demonstrates how an entity can belong to multiple
groups. A university student can at the same time have the label Person and
Student.
Properties
Properties are key-value pairs of data stored on nodes or on relationships. They allow you to store relevant data about the node or relationship with the entity it describes. Properties support most standard data types like integers, strings, booleans, etc. The flexibility and simplicity of properties allow users to easily review the data structure and update it according to their needs. Properties are also very easy to spot. One common way would be asking yourself questions about the nodes and relationships in your model. What information will you need in the future when working with the graph?
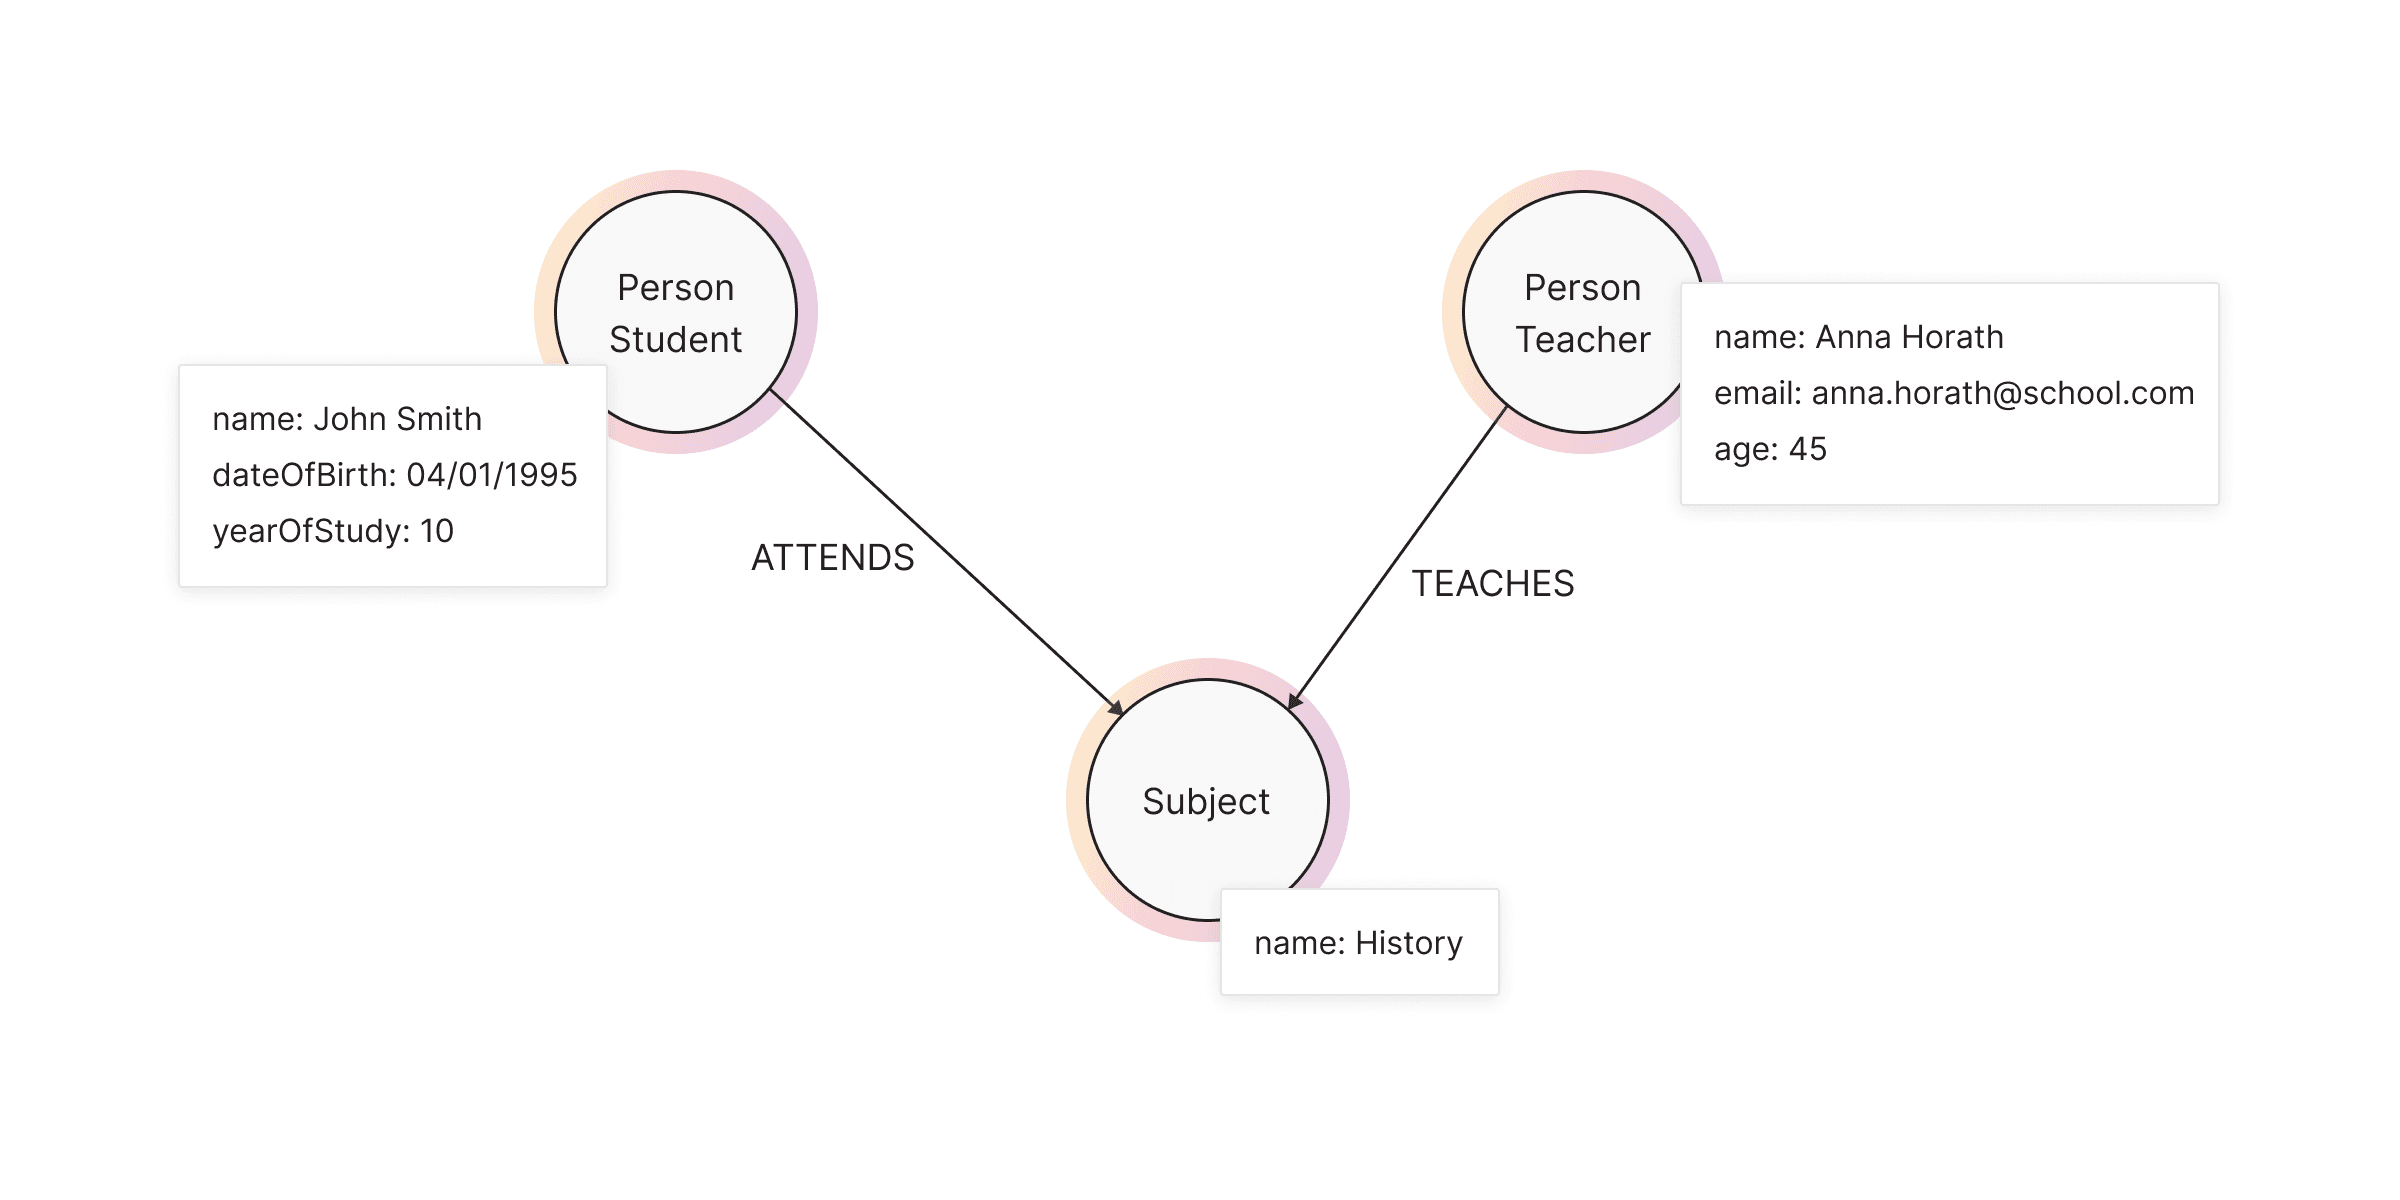
In the university example, the most relevant questions and their corresponding properties would be:
- What are the names of the students, professors, and courses? -
name - How old are the students and the professors? -
dateOfBirth,age - What year of studies does the student attend? -
yearOfStudies - How to get in touch with the professor? -
email
Designing a graph database schema
Now that you are familiar with basic terminology it is time to dive into graph database schemas.
When designing a graph database, the first and most important step is defining what it will be used for. Different requirements will lead to different information structures, relationships, designs, and in the end, implementations. When starting with the design process, it is always a good practice to write down the requirements the database needs to cover.
In the graph world, the “property graph” style of graphing makes it possible to rethink the representation of data models. This kind of data model is very close to what people draw on whiteboards. They are easy to visualize and easily follow the thought flow.
Graph property model
From trying to explain concepts while holding the presentation to complex board pins-and-red-string connections seen in detective movies, we are trying to explain the connection between data. Connections (relationships) are an essential part of graph databases. Because we are trying to explain them on a whiteboard sketch, it’s easy to transfer those sketches into graph schemes. This is what makes graph databases easy to visualize - connection to common real-life models and applications.
Graph modeling starts from the domain itself. Domains come described in the form of requirements written down by clients or during the interviews. The graph structure is hidden within those requirements. The first step when modeling the database is to identify key entities that you have learned about in previous steps: nodes, labels, relationships, and properties.
This will allow you to go from your whiteboard sketch to a full graph model.

To make things not so abstract, imagine the following scenario that you will model:
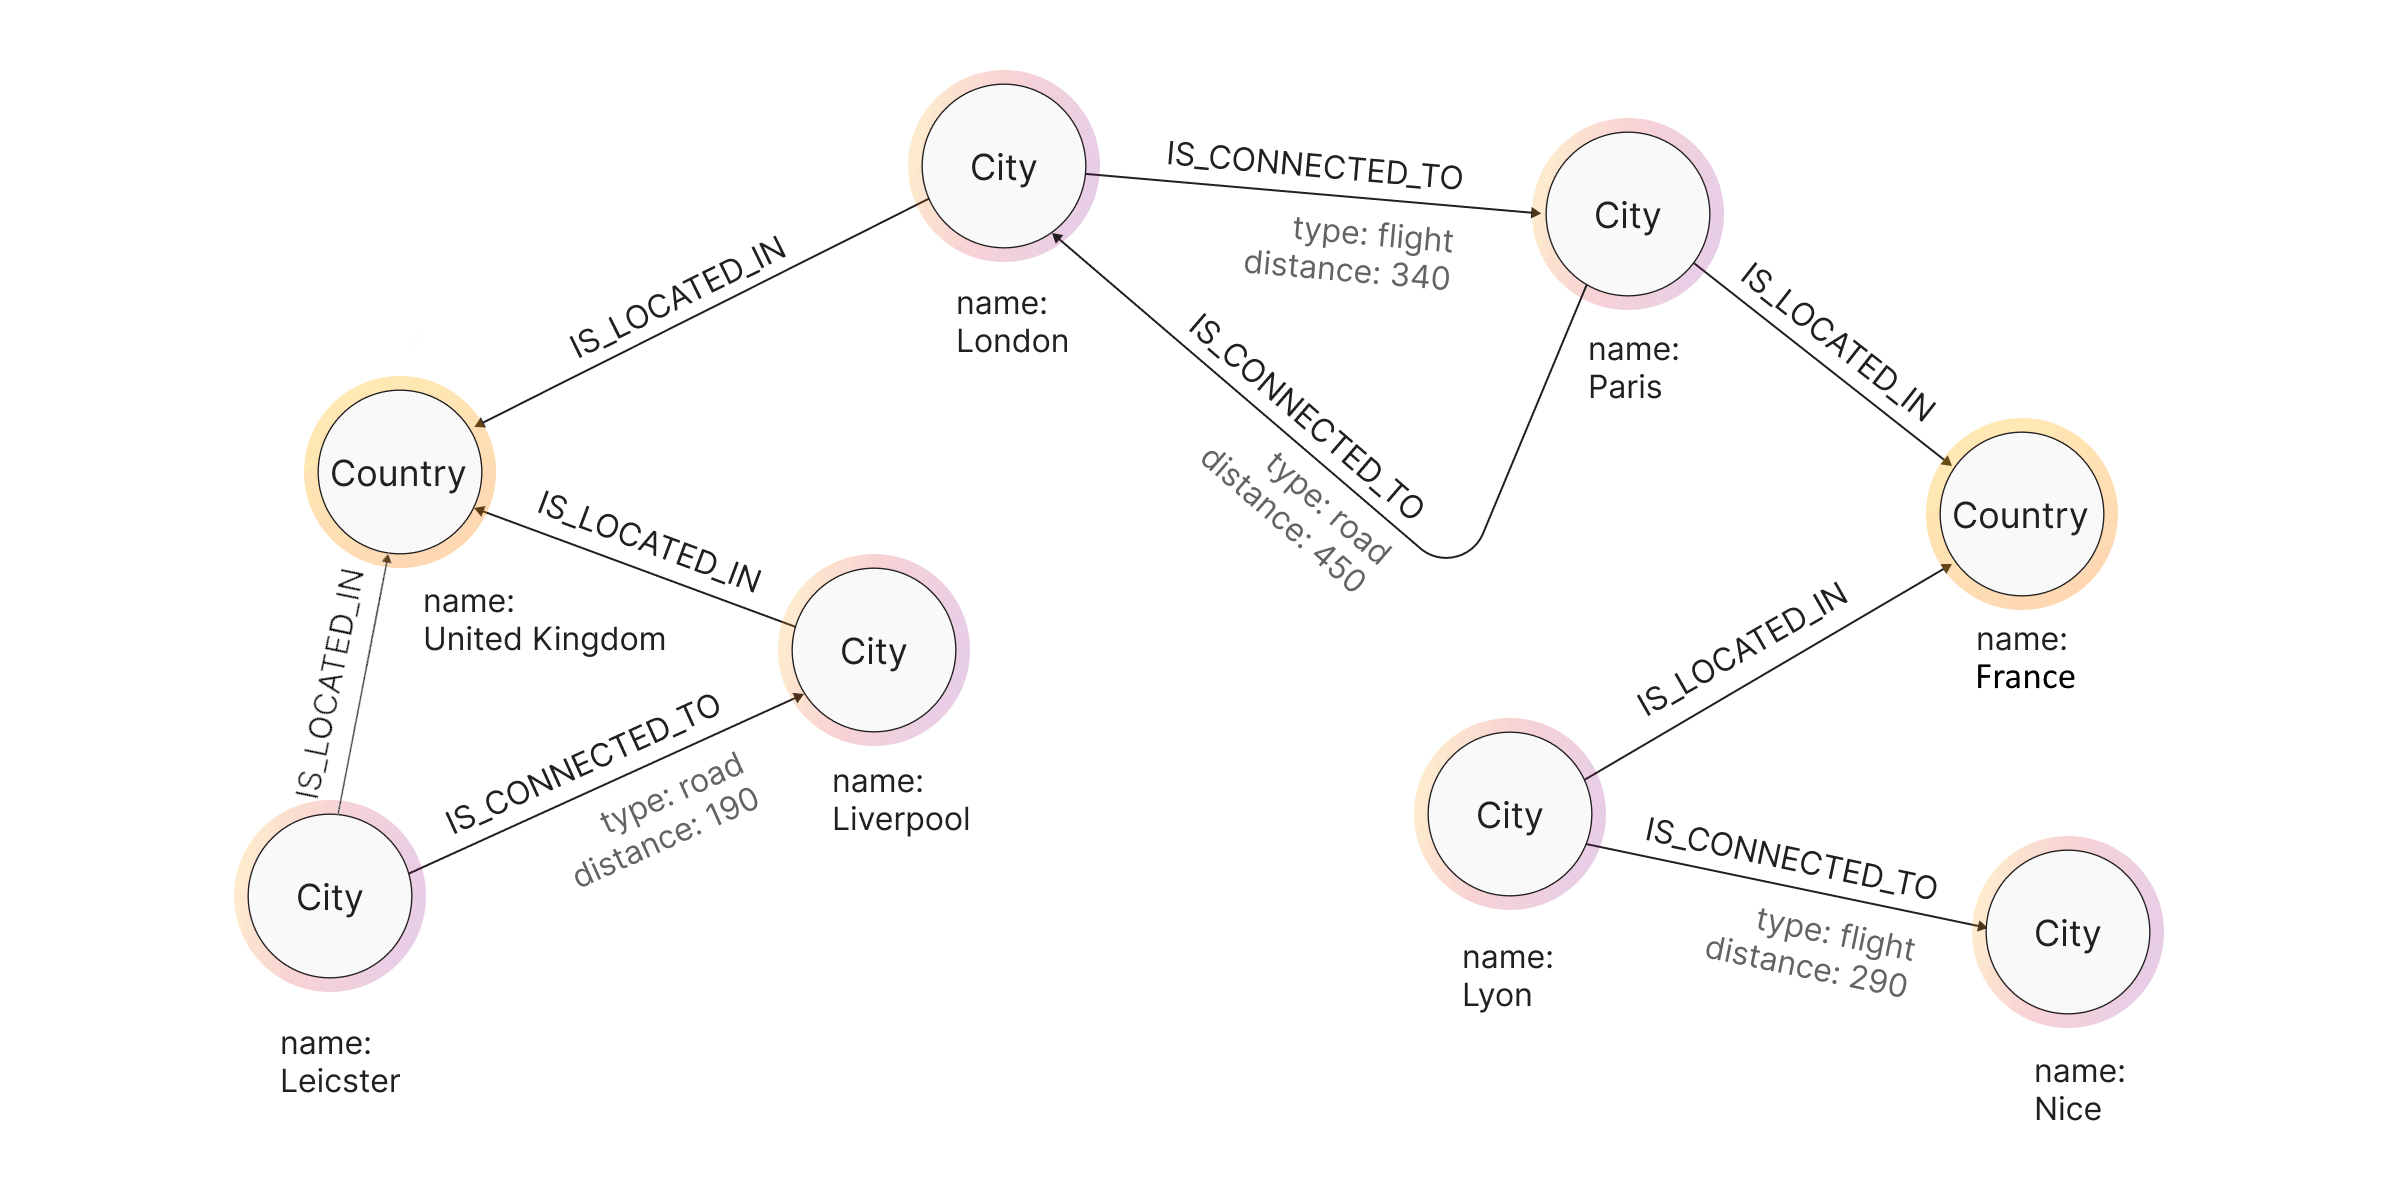
Cities London and Paris are connected via flights. They are also connected by road. Distance between London and Paris is 340 km if we fly between and 455 km by road. London is located in the country England, as are Liverpool and Leicester. Those cities are connected only by road and the distance between them is 190 km. Paris is located in France, as are Lyon and Nice. Lyon and Nice are connected via flight and the distance is 290 km.
You got a lot of information within this scenario so let's break it down into pieces and then connect them:
- Identify nouns and verbs for the sentences:
- Nouns (cities, countries) represent nodes or labels
- Verbs (are connected, is located) represent relationships
- Identify specific information:
- Words that describe the type of connection and distance are properties of either nodes or relationships
Now it is easy to piece them together to form a graph. Your final result should look something like the image below.
Defining the requirements
In the previous section, you have seen where to start and what your goal is. Let's go together through another example. This is a document with requirements that you will use:
The Language School is a language training school. It offers language classes for client companies, which can be either held at the clients' offices or at the School itself. The School employs teachers who may teach multiple courses. The School has clients who may offer multiple courses via the school. Clients offer courses to their employees, who have the option to participate. Each course is offered by one client. Each course has one teacher at any given time. Participants in the course are employees of the clients. Each participant can be employed by one company at a time. Participants may be enrolled in more than one course.
When given the requirements document, it is important to read it carefully and to make notes of the things which might become entities, i.e. nodes, in our database and what would be the possible relationships between them. The very first step we are going to take is designing a base graph schema. A graph schema is a diagram that maps the relationship between nodes that are part of our database. Creating a graph schema is very helpful because we have everything planned in advance, and it can decrease errors while implementing the database design.
Identifying the nodes
As you already know, nodes will most often be represented as nouns in the
sentence. Reading through the requirements, we can identify some possible
candidates for nodes: school, language, clients, offices, teachers,
courses, employees, participants. Not every noun written in the
requirements has to become a specific node as seen in the following example:
employees and participants refer to the same subject so we can use one label
and node model for the participant of the course. For the sake of simplicity, we
will assume that courses take place at the client’s office and each client has
exactly one office. With that in mind, we can easily identify four node
types/labels - Teacher, Course, Client, Participant.
Mapping the relationships
Relationships are noted in the requirements as well. Most often, they are
represented as verbs. It is stated that each teacher instructs one course. From
this statement, we can infer our first relationship in the graph model:
teaches. We can model our first relationship:
(:Teacher)-[:TEACHES]->(:Course) . Reading further, we can identify other
relationships between the nodes: (:Client)-[:OFFERS]->(:Course),
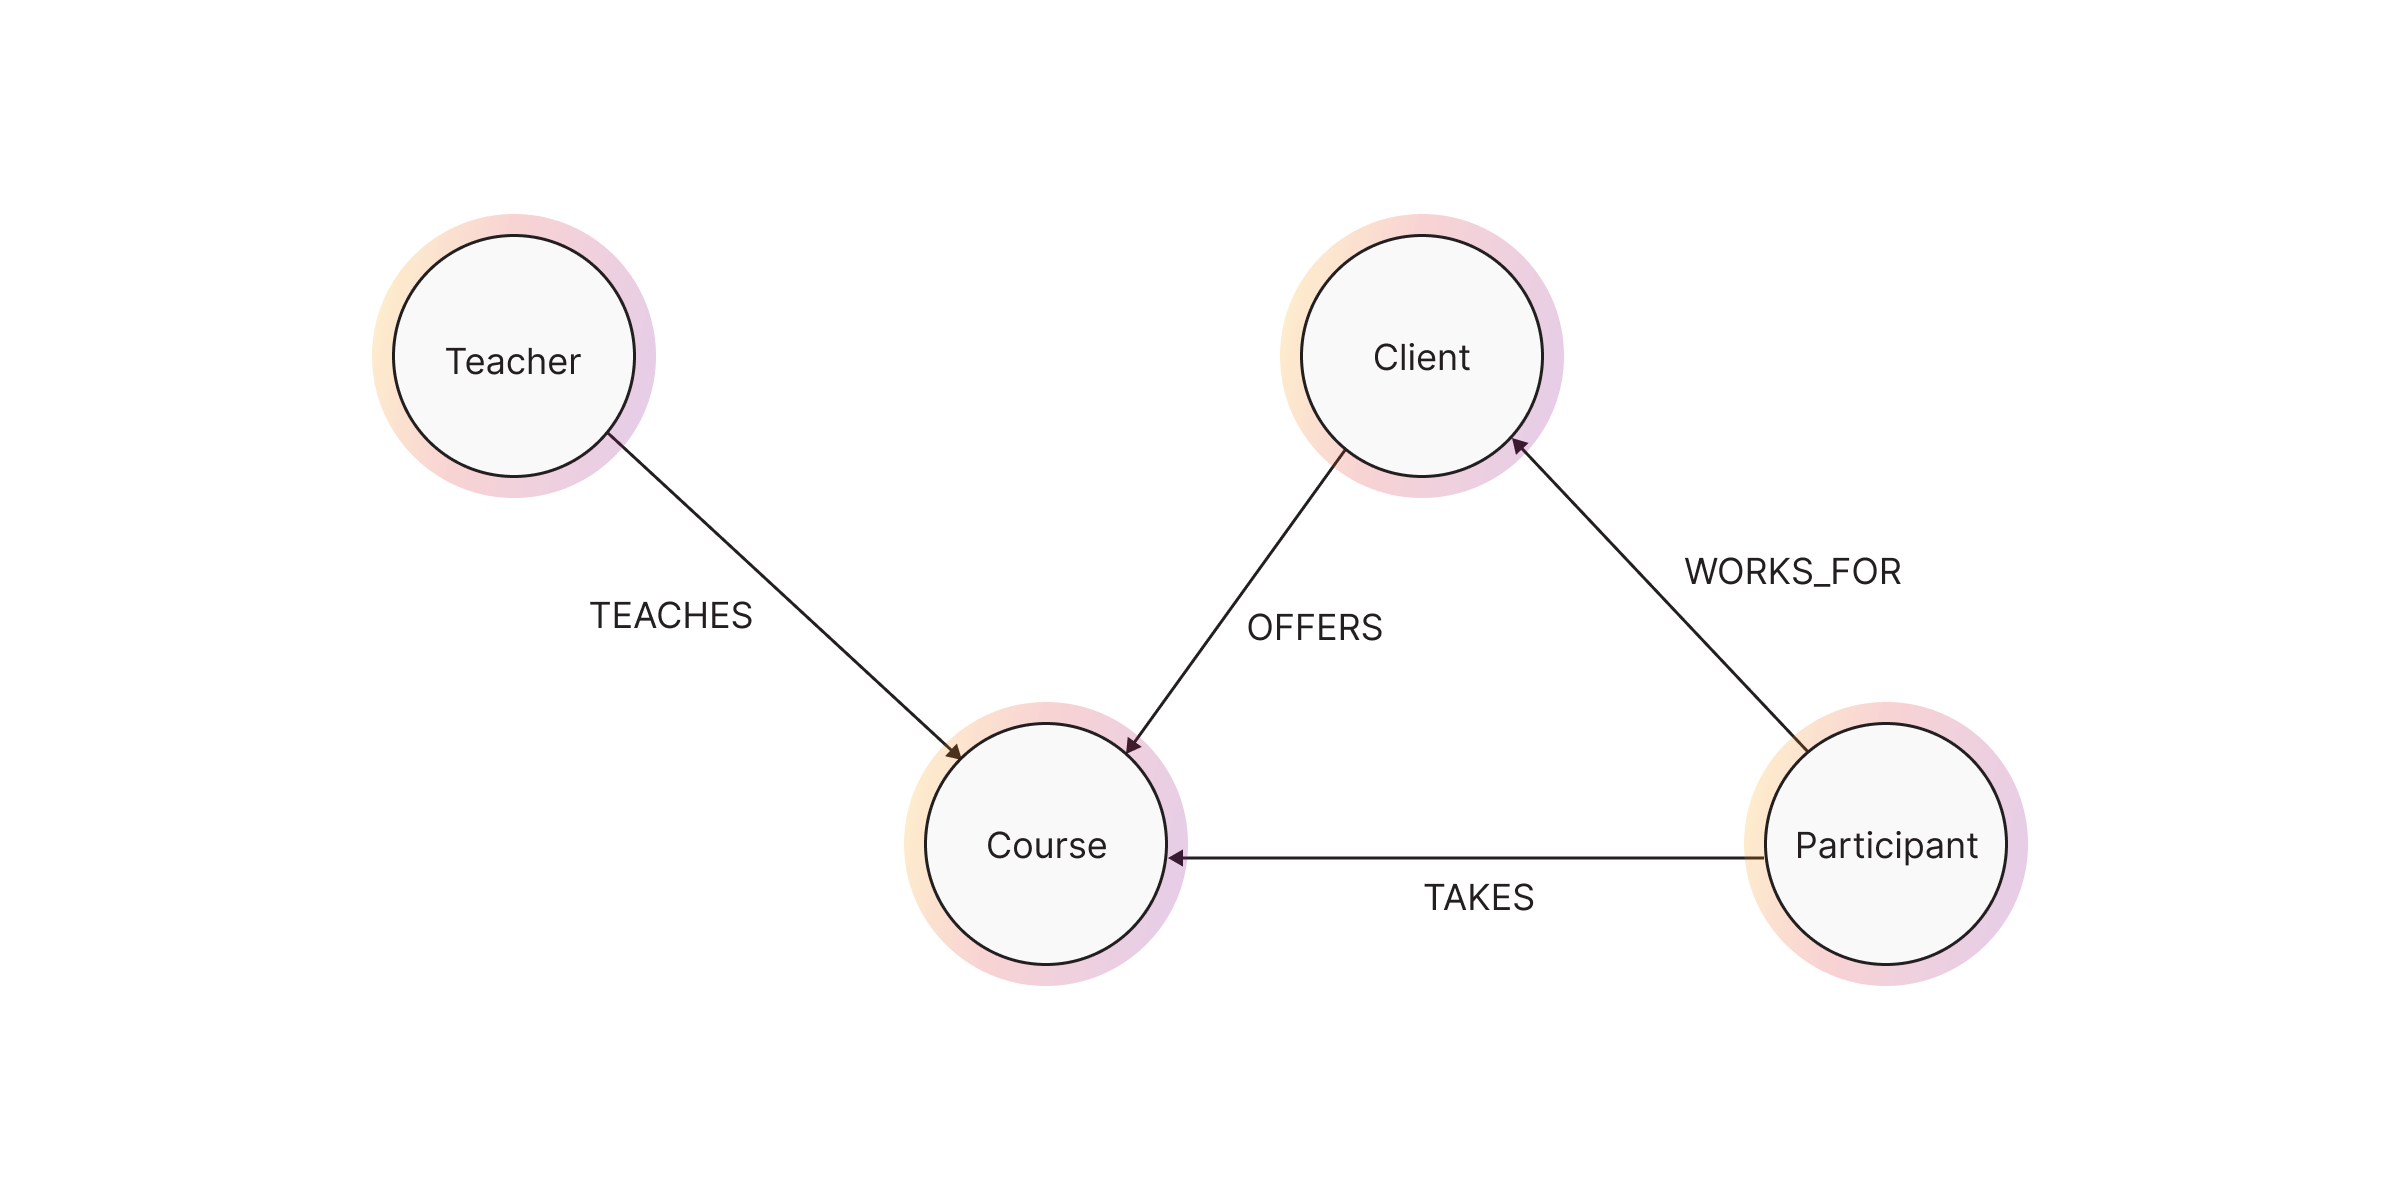
(:Participant)-[:TAKES]-(:Course), (:Participant)-[:WORKS_FOR]-(:Client).
Now that we know all of the relationships and node types, you can draw our graph
schema.
Properties to store
At this moment, your graph schema is just an empty shell. But, now that you have
a basic model, you can populate it with data. Before data import, you need to
define which properties you want to store. This can be specified in the
requirements document or it may be left to your discretion. Sometimes, logical
or natural data won’t be mentioned but it will be implied. For example, a
teacher is a person and each person has a name and a surname. Naturally, this
doesn’t have to be mentioned, but data like which language the teacher knows
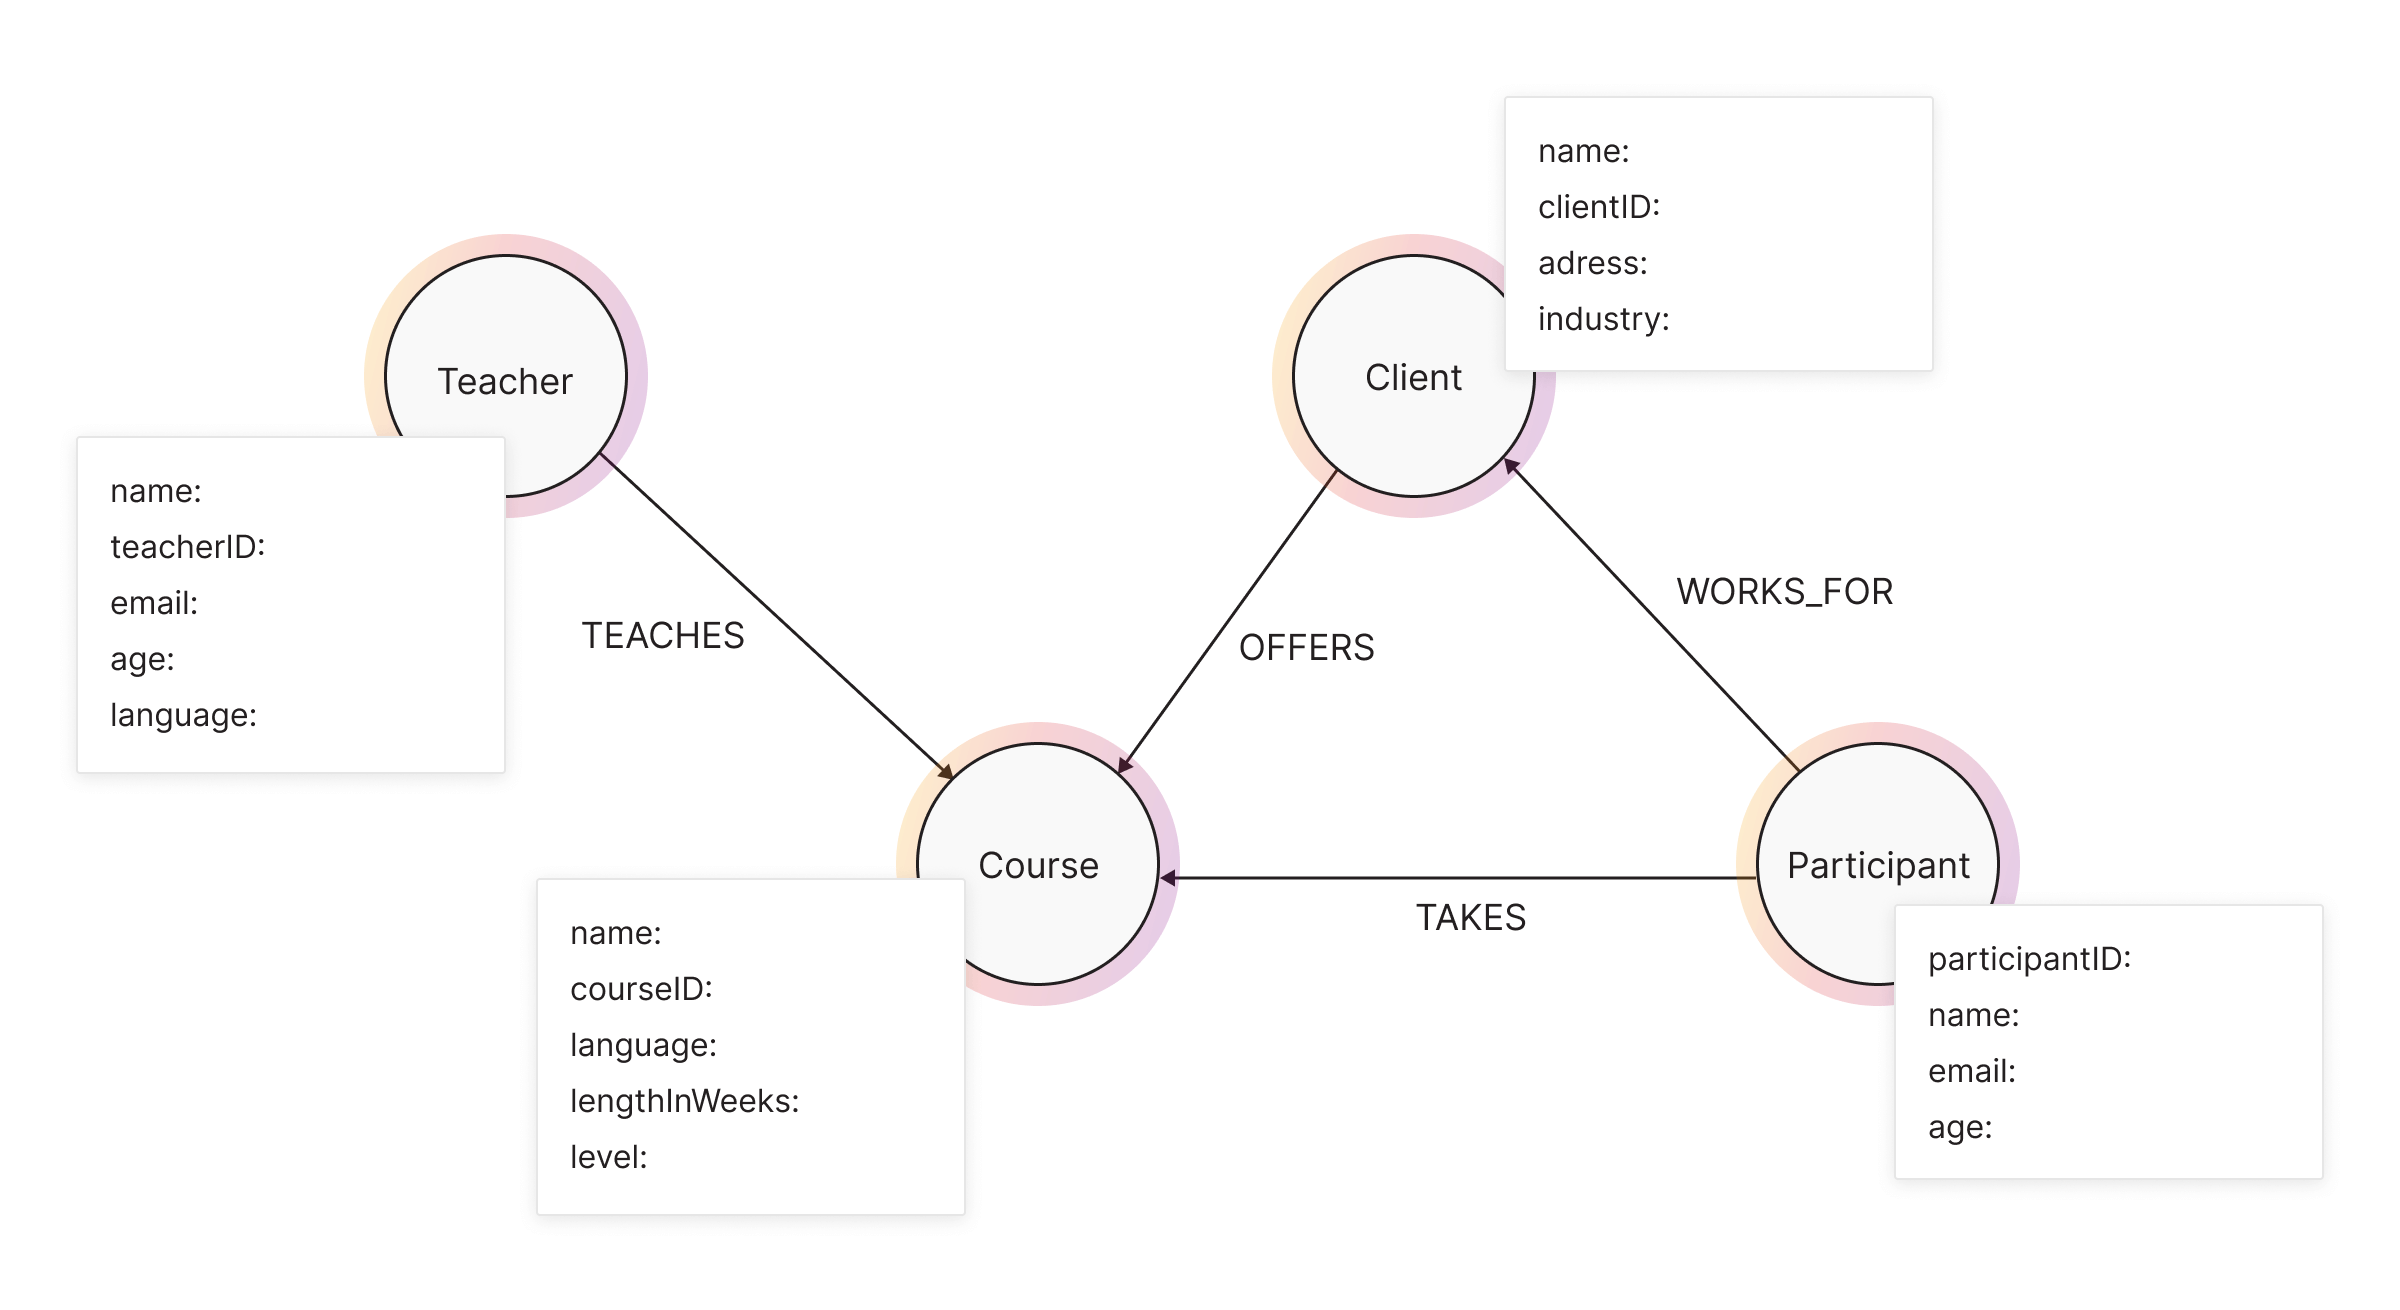
should be specified. So, our Teacher node should store some kind of ID, the
teacher’s name and surname, an e-mail address, the date of birth, and languages
they can teach. In a similar manner, we decide the data for the rest of the
nodes. In the end, our graph should look like this:
3.5 Should I use property or relationship?
Graph property models are not so complicated as they may have appeared, right? One of the questions that have probably come to your mind while reading this is: are there some exceptions to those rules?
You have asked the right questions! Sometimes, there are exceptions to some of the rules. One of the decisions that could be encountered is whether to model something as a property or as a relationship. The main idea behind deciding whether something is a property or a relationship is limiting the search as early as possible. Looping through the properties when trying to search particular data stored in them can greatly increase memory usage and take a toll on performance. It makes sense to create new nodes (and relationships as a consequence) if data stored in properties is considered shared.
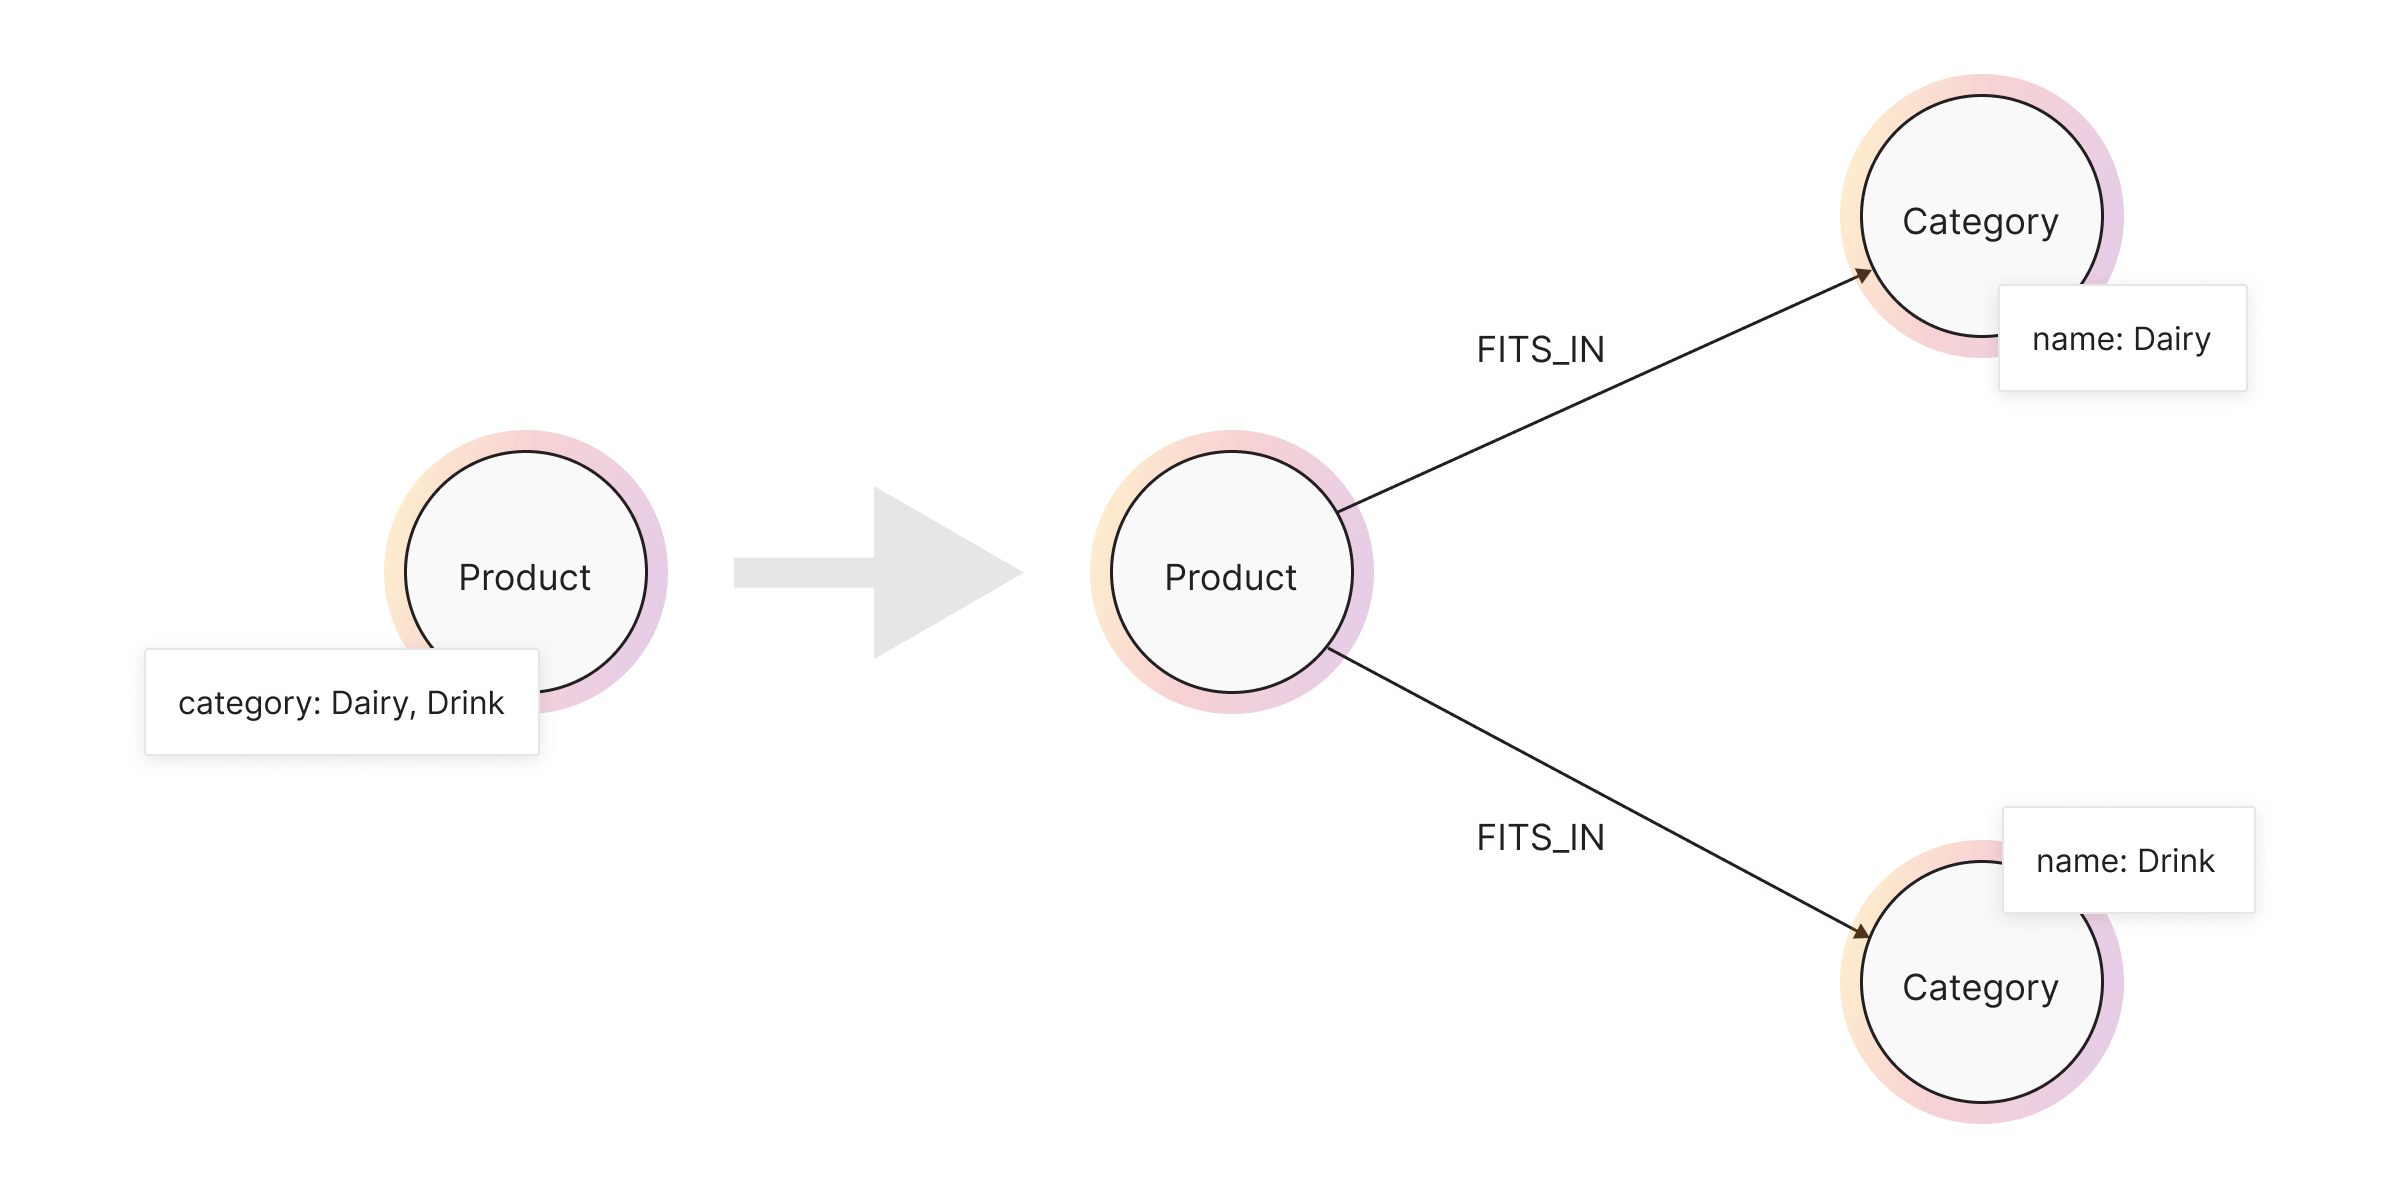
Here is another example for you. In it, you will model the data on the Product node. Products in stores can be fitted in different categories. If you want to find out which categories Product falls into, you need to look up what’s listed in the category property.
MATCH (p:Product {name: ”Milk” }) RETURN p.category;
It is common knowledge that certain products share the category. If you want to find out which Product nodes share the same categories as Milk does, you would need a more complex query, looping through each category in the property array. This option would make performance take a toll, and this is exactly what you want to avoid.
So, if you model your categories as separate nodes and create a relationship between them, your model would get more complicated.
Choosing between setting a value as a property or a separate entity depends on the type of analysis you want to make on the dataset. If the data serves only as information and it’s not used in any type of analysis, the first approach can be used. But if the data is used to find common grounds or in group analysis, then the second approach will improve performance for those query types.
4. Types of graphs
There are some characteristics that define the type of graph. Here are some basic types:
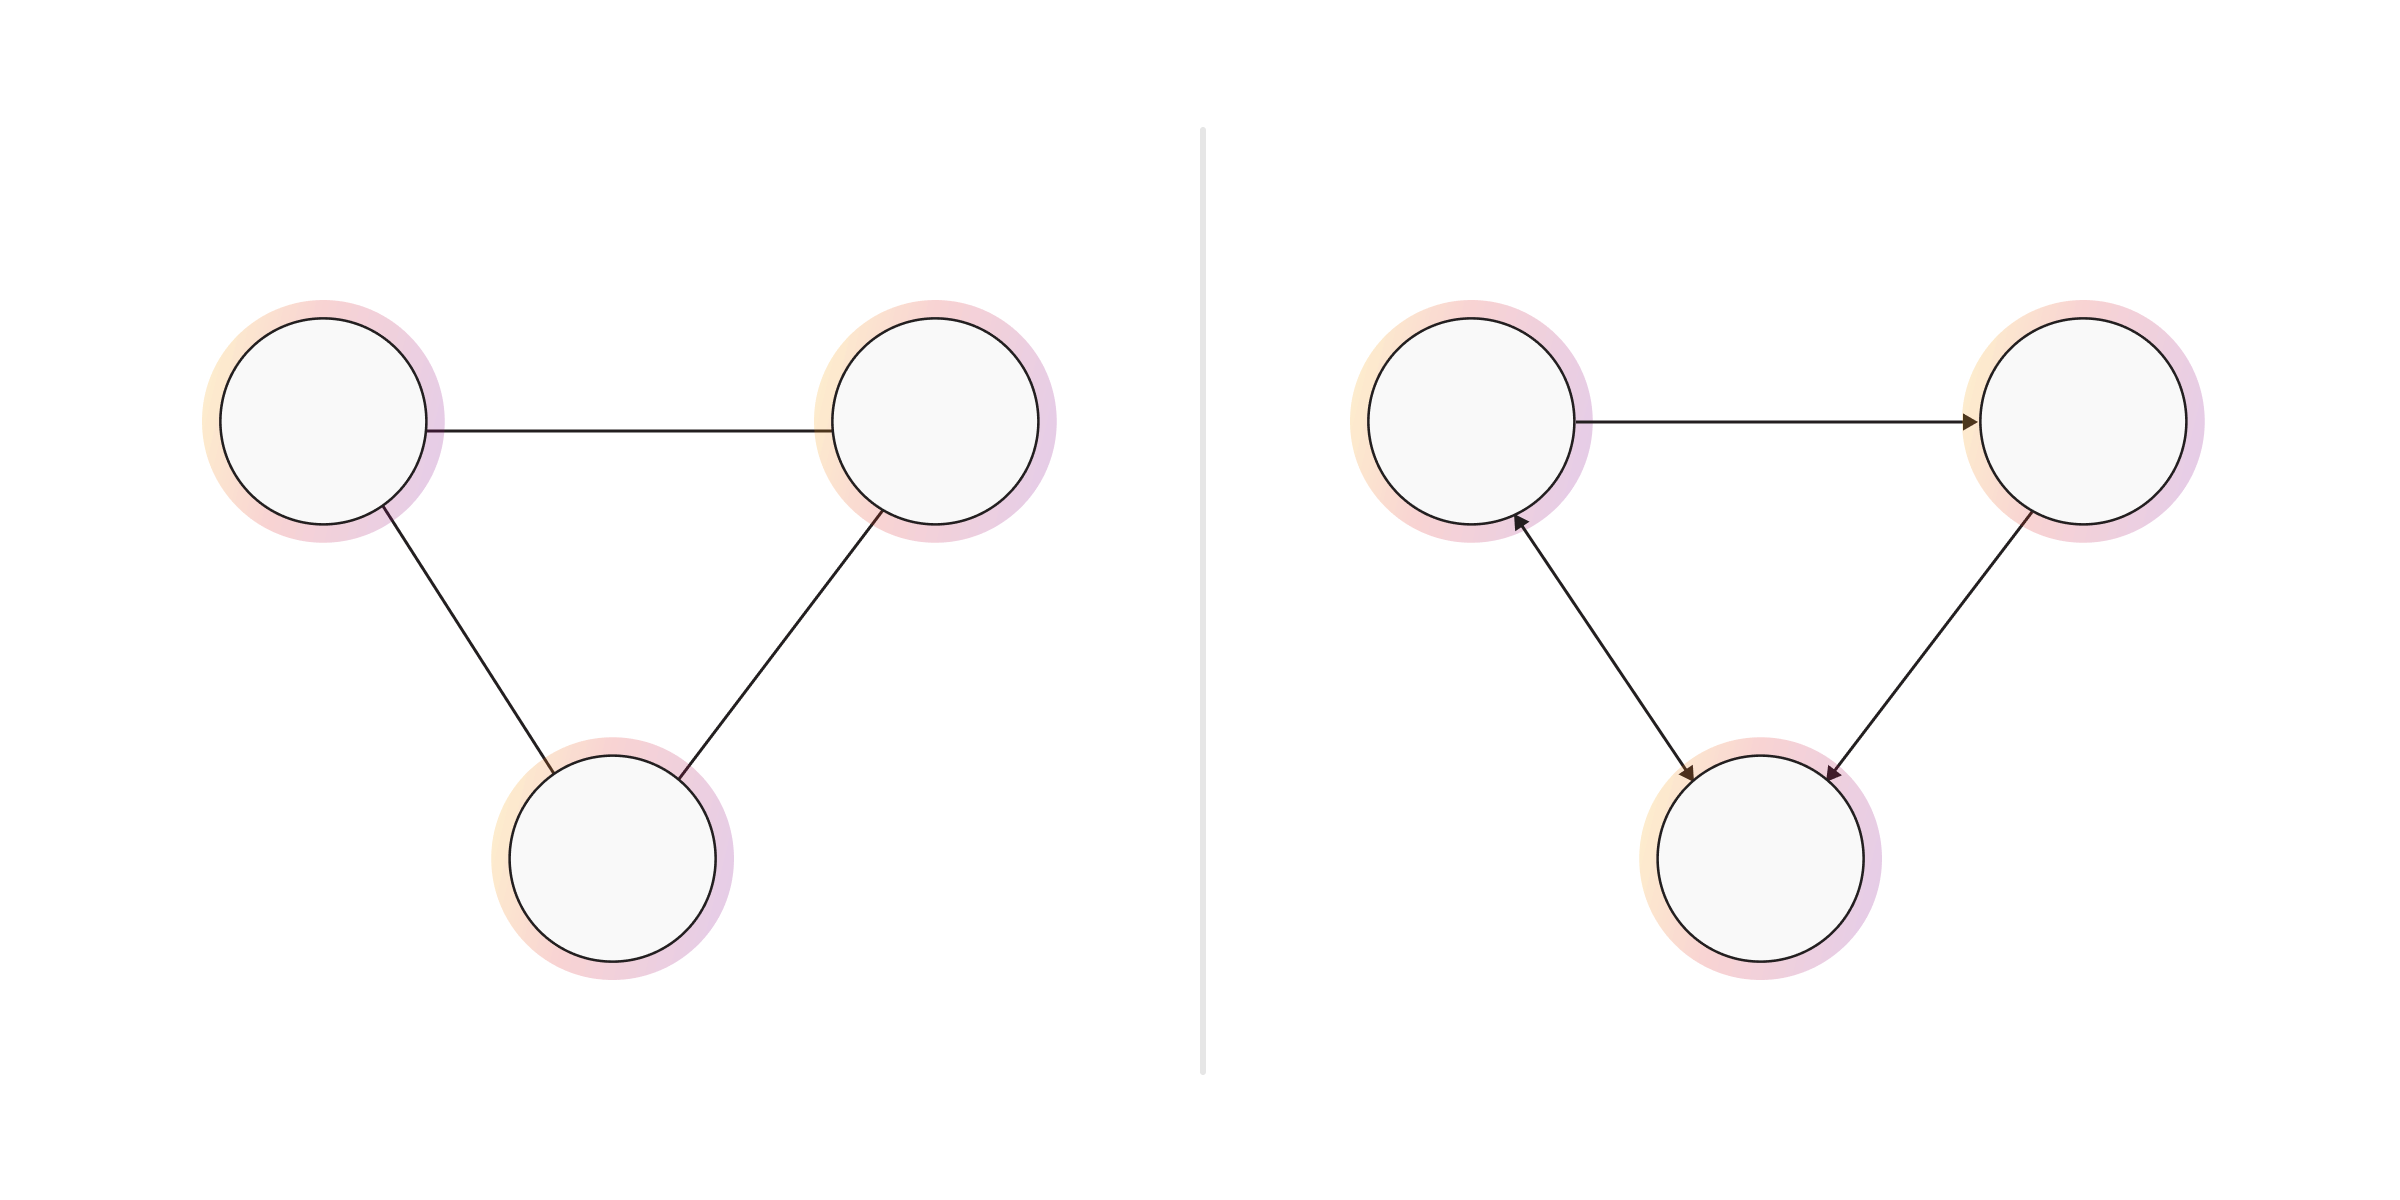
- Undirected and Directed Graphs - In an undirected graph, the relationships have no orientation. These relationships are sometimes referred to as bi-directional. The relationships in a directed graph have an orientation.
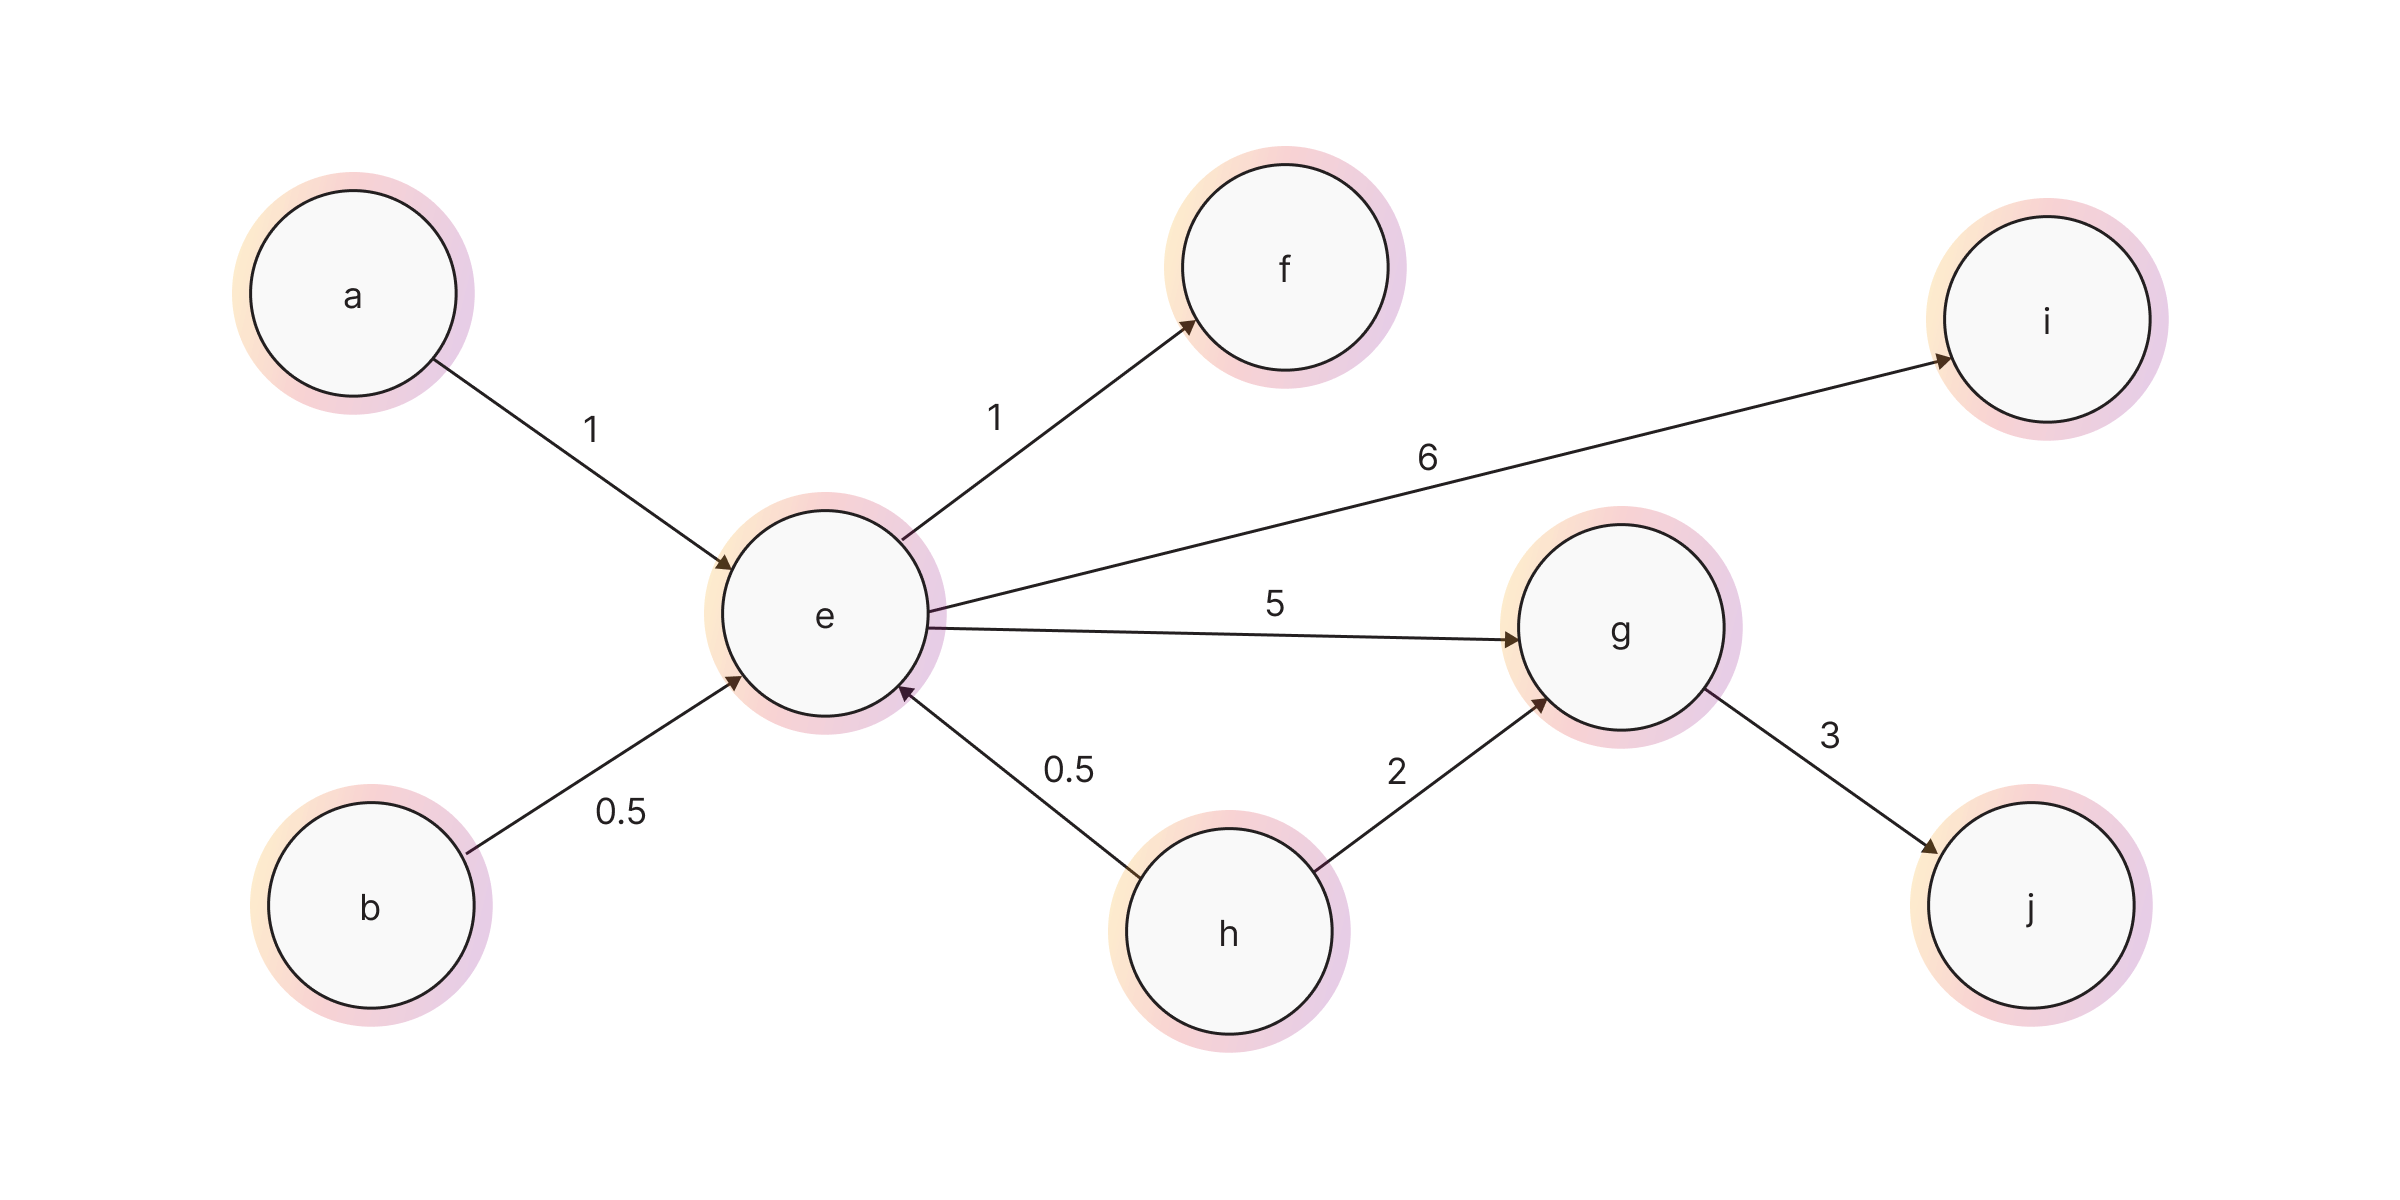
- Weighted And Unweighted Graphs - A weighted graph has attributes on its relationships that specify their weight. For example, a relationship that represents the distance between two cities would have this distance stored as a relationship attribute. Unweighted graphs have no such relationship attributes and are sometimes referred to as Non-Weighted Graphs.
On top of direction and graph can also have a self-loop (also called a loop or a buckle). Self-loop is a relationship that connects a node to itself, while parallel relationships (also called multiple relationships or a multi-relationship) are two or more relationships that are incident to the same two nodes.
With a combination of mentioned characteristics and properties, you can create different graphs:
- Graph - An undirected graph with self-loops.
- DiGraph - A directed graph with self-loops.
- MultiGraph - An undirected graph with self-loops and parallel relationships.
- MultiDiGraph - A directed graph with self-loops and parallel relationships.